Bitcoin Just Changed Course. This Signal Explains Why

 |
| By Juan Villaverde |
Since the summer, I’ve been calling for a low in October.
That’s because Oct. 18 was highlighted as such by Japanese M2 (JpM2) — one of the most faithful forward-looking Bitcoin (BTC) indicators over the past year.
Here’s the problem, though: Bitcoin hasn’t been correcting.
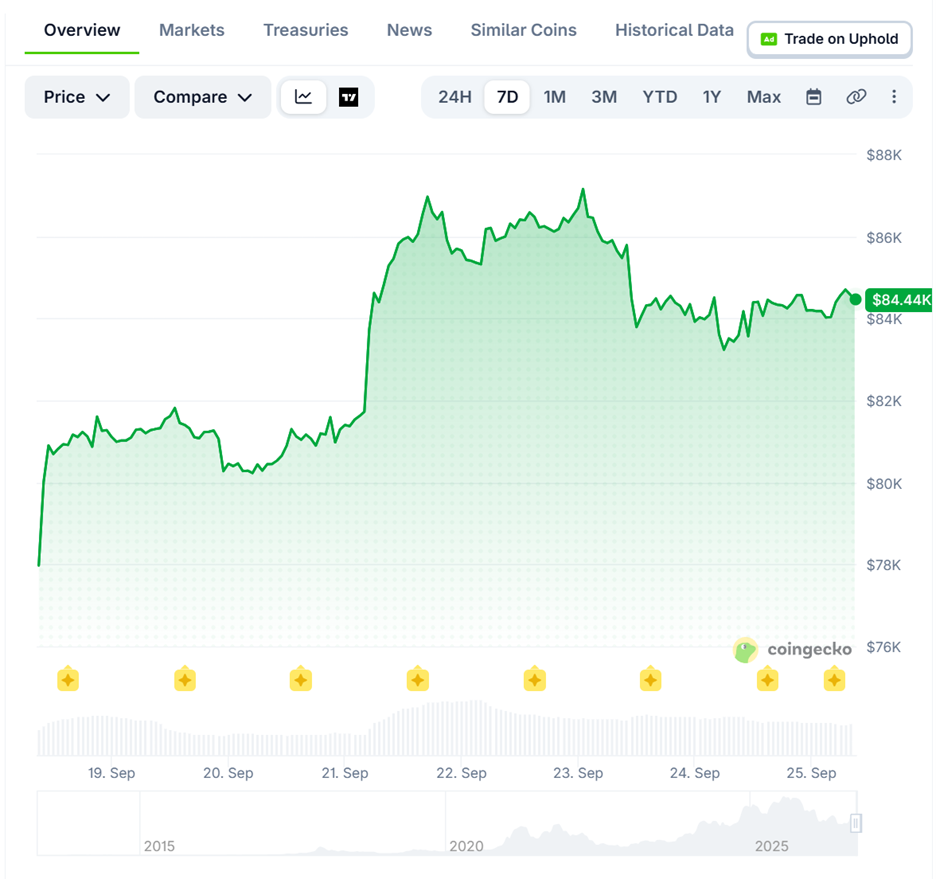
In fact, the OG crypto has shown surprising strength and even rallied slightly above key near-term resistance at $83,000 in the past few days.
Which is why the No. 1 question I’ve gotten over the past week has been …
Should We Still Expect an October Low?
This is the critical question on my radar right now.
It matters for both traders wondering if they should grab gains and run …
And for long-term investors wondering if they should load up now … or wait for a better entry based on previous expectations.
So today, I want to dive into what my indicators have to say about what’s changed. And what hasn’t.
Schrodinger’s Cycle Low
The short answer to my No. 1 question is yes, we could still see a mild correction into Oct. 18 …
But time is running out.
Let’s assume Bitcoin starts to fall today. In that case, we would likely see a low come in around Oct. 18.
But in such a short amount of time, we shouldn’t expect anything meaningful.
And that outlook is reliant on a pretty big assumption. One that BTC’s recent price action just isn’t showing.
So, what gives? Why is Bitcoin suddenly going rogue?
Because it stopped following JpM2.
Instead, it's following another of its leading liquidity indicators: Treasury bonds.
A Quick Note on Indicators
This is what sometimes makes forecasting so difficult.
Indicators are wonderful windows into Bitcoin’s near-term future. But they can also be fickle at times. Just like cryptos can.
We know JpM2 — and liquidity in general — leads Bitcoin by about three months.
We also know the 10-year Treasury Note leads Bitcoin by roughly 13 months.
Of the two, liquidity generally has a better track record.
Which is why when bonds say BTC will go higher …
But liquidity says lower …
I tend to favor liquidity and disregard the bond market's view.
And that’s exactly what happened after the late June low. And what I pointed out to you in early July.
But ultimately, the truth is in the price action. And in this case, Bitcoin doesn't much care about liquidity.
It's made itself clear: It’s following the bond market.
This is evidence-based forecasting. We use liquidity as the primary tool. But when it's shown to be wrong, we switch to other forward-looking indicators.
Normally, over 90% of the time, the bond indicator and the liquidity indicator agree. And we use both in combination.
When they disagree, the protocol is clear — use liquidity first. Switch to bonds only once the liquidity view is proven wrong.
Now is one of those rarer windows when we have to look to bonds.
Bitcoin’s New Drumbeat: Treasury Bonds
Let me start with an observation: We can research and measure indicators going as far back as crypto inception. And form reasonable expectations for how each one works.
But every new day still brings different challenges.
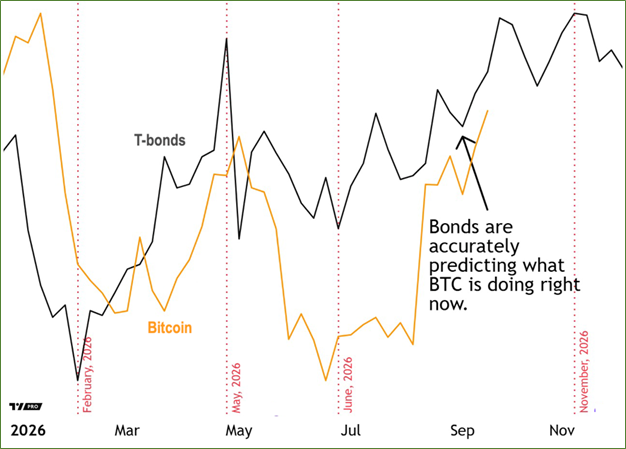
I've shown this chart and discussed it before. It matches Bitcoin's price action almost exactly …
- A projected correction down to the first week of February at the start of the year. Check.
- A rally into late April/early May following that low. Check.
- A sell-off between early May and late June. Check.
Keep in mind, the alternative macro indicators I use — JpM2 and Central Bank Liquidity (CBL) — also showed these same moves.
But from that late June low, JpM2 and bonds diverged.
As you can see below, JpM2 showed a rally from late June into an early August high, followed by a correction into Oct. 18:
Ditched Like a Jilted Lover
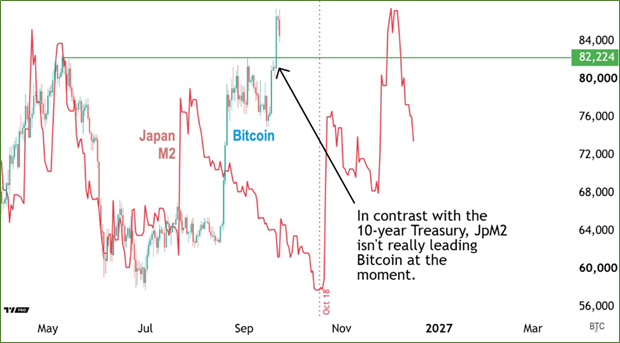
But we're almost to October … and no high has taken place.
That, combined with Bitcoin’s recent strength — which could indicate we skip the October low all together as well — is why I’ve turned by attention to bonds.
As I said above, when BTC diverges from liquidity, bonds become our next best crystal ball.
With that in mind, take a look at Figure 2 again. That’s the chart tracking BTC’s price against T-bonds shifted forward by 13 months.
The red dotted horizontal lines highlight the key pivots for Bitcoin in 2026 according to the bond market.
There’s no August high. And no October low.
Instead, the late June low — which my model confirmed as June 25 — is followed by a rally into early November.
As you can see, bonds also flatten between early October and early November. That tells us the high could land anywhere in that window.
Since this appears to mirror BTC’s price behavior, this is the map we’ll use for now.
Coincidentally — or not, in my opinion — my own forecasting model happens to agree with the bond market right now.
Take a look …
Bitcoin’s 80-Day Cycle
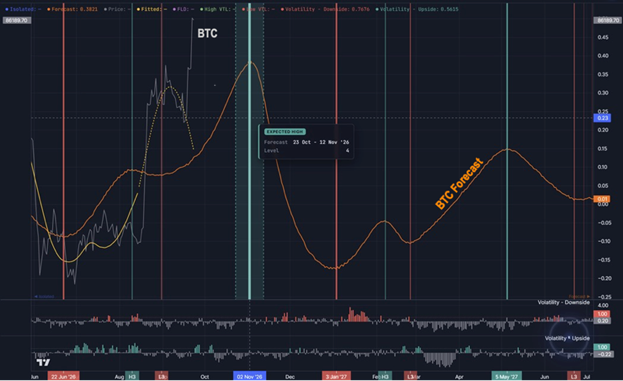
The orange line is the forecast for Bitcoin's 80-day cycle. It shows a high centered on Nov. 2, with a range between Oct. 23 and Nov. 12.
Which lines up very nicely against the bond market's forecast.
So does the projection for the next low. According to my model, the next low after that isn’t until Jan. 3. Bonds put it near mid-February.
Ideally, as we get closer, we’ll be able to narrow that window even further.
Going Back to Our Original Question
Now that you understand the context and the current set up, let’s ask our question again.
Will we see a low in October?
We may. I genuinely can’t rule it out just yet.
But that ship has probably sailed.
The more likely scenario at this point — according to both the T-bond indicator and my Forecasting Model — suggests Bitcoin will rally into a high in late October to early November.
After that, we’ll likely see the broad market consolidate into early 2027.
For traders, this means opportunity to load up in the near term and grab gains soon.
For HODLers, keep your entry targets solidly in sight. They may approach faster than you expect.
In fact, my Crypto Timing Model has sent a few key alerts this week. Both for my Weiss Crypto Portfolio traders and my Weiss Crypto Investor HODLers.
That’s the power of my algorithm at work. It filters out the noise and emotion to trade only on what the market itself has to say.
To learn how it can help in with your long-term crypto portfolio, click here.
Best,
Juan Villaverde