Has Bitcoin Already Bottomed? This Price Level Could Tell Us

 |
| By Juan Villaverde |
Crypto markets continued to rally into the week, with Bitcoin (BTC, “B+”) hitting $67,000 on Tuesday. Then, however, it hit a wall before settling back to $65,000 and change.
Today, it fell a little further to roughly 64,200 as I write.
Here’s what I keep coming back to: All this was entirely expected and in line with what JpM2 predicted for this period …
A rally starting from an 80-day-cycle low expected around June 21 (actual low occurred landed June 25). Followed by mostly higher prices through July 29.
Some of you were quick to point out that my Timing Model expected this bottom to occur on July 18. While Japanese M2 (JpM2) — the liquidity indicator that Bitcoin has followed most closely over the past year — pointed to yet another low on July 22.
That led me to speculate the June 25 bottom might get retested sometime between July 18 and 22.
But that didn't happen. Instead, Bitcoin dipped briefly on July 17 and rallied right off that low. And then pushed to $67,000 in a move that, for all intents and purposes, has entered its final stretch.
Circling back to that "missed" July 18–22 low: This isn't really a miss. It's simply how the correlation between my forecasting model, Japanese M2, and actual Bitcoin tends to behave.
Broadly speaking, both JpM2 and my Forecasting Model were correct: There was indeed a low between late June and mid-July. In fact, that June 25 low was slightly exceeded on July 1. Take a look:
Bitcoin’s Roadmap
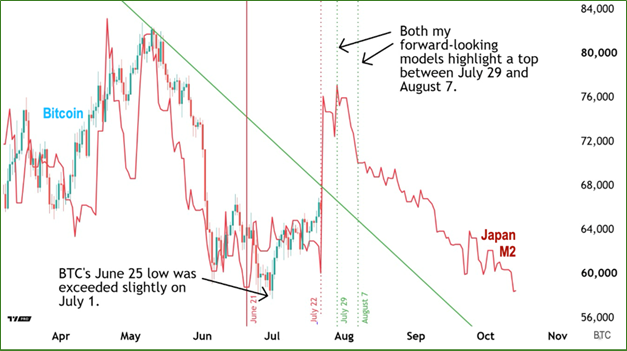
A bottom between June 25 and July 1 is what we ultimately got — and that's normal and expected. Because both models carry a margin of error.
That is, they aren't exact GPS coordinates; merely a roadmap for what to expect going forward.
Notice also that the July 22 low on JpM2 (see the red dotted vertical line) wasn't really the important one. The real low for this window was June 21 (the solid-red vertical line). Bitcoin's actual low occurred within days of that forecast.
How this Context Frames the Next Few Weeks
Once again, both JpM2 and my Forecasting Model agree on when this rally ends: somewhere between July 29 and Aug. 7. The early dates come from JpM2, the later ones from my Forecasting Model.
The actual turning point may not land exactly within that window. It could come a bit sooner, or a bit later. For example, JpM2 forecast Bitcoin’s most recent bottom would occur June 21. While my Forecasting Model pointed to July 18.
However, the overall shape of the actual low was right on target: a double-bottom between June 25 and July 1. That's simply how these models work in practice.
Now, as I've said many times, this late-June, late-July rally was never expected to be particularly impressive. In fact, my trading algorithm barely picked up any crypto exposure during this interval.
But it may prove significant for another reason: If the rally continues for another week or two, Bitcoin will confirm that its 4-year-cycle low has already been established, between June 25 and July 1.
How high does BTC need to go? Watch the green downtrend line (on Figure 1). If Bitcoin rallies above $68,000, it will have crossed it.
Technically, this line connects Bitcoin's last two confirmed 320-day-cycle tops. Per my model's framework, a confirmed crossover means Bitcoin has left behind a bottom of a cycle larger than the 320-day cycle. And the next one up from there is Bitcoin's well-known 4-year cycle.
So, in the final stretch of a rally that likely has only a week or two left, Bitcoin may actually confirm that the bear market is officially over.
But don't expect any fireworks right away. Few will notice this subtle shift in trend. Most market participants never do.
For now, and over the next couple of weeks, keep an eye on $68,000. If you see Bitcoin push past it, you'll know the worst is behind us.
Best,
Juan Villaverde
P.S. As I said, the real fireworks don’t come right when a long-term low is made. All it means is there’s no more appetite for selling.
That’s why I watch macro indicators — like global liquidity and Treasury bonds — to see when the broad set up aligns with the cycles. Those give me solid insight into when the real showstopper will appear.
In fact, my favorite indicators can now see when I expect the big run to begin. And, more important, when investors should load up before then.
To see for yourself, click here.