 |
| By Mark Gough |
A week ago, DeFi expert Marija Matić revealed the data: Bitcoin (BTC, “B+”) has been outperforming gold.
Here’s the important bit: The implications are deeper than a one-off event.
And we know this thanks to the BTC/Gold ratio. It’s an indicator of Bitcoin’s relative strength compared to gold.
Because of that, it can be used to assess BTC's behavior as “digital gold” during periods of inflation and instability on the global cryptocurrency and precious metals market.
Right now, it’s down roughly 70% from its peak.
Drawdowns of this size are notable. And in every prior cycle, they’ve marked either a bottom or a critically close inflection point.
But what’s particularly compelling is that this drawdown is happening as three independent technical signals are converging:
- A historically validated drawdown depth,
- A harmonic reversal pattern completing at textbook levels,
- And momentum indicators scraping cycle-low extremes.
When a historical pattern, harmonic geometry and momentum exhaustion all align on a single weekly chart, it indicates the bulls should be in charge.
All while gold's own technical posture introduces a potential mechanical tailwind for the ratio.
So, let’s break down each of those three indicators and how they boost Bitcoin’s bullish outlook.
1. Historical Drawdown Signal.
The BTC/Gold ratio has now experienced four drawdowns of 70% or more since 2017, as you can see below.
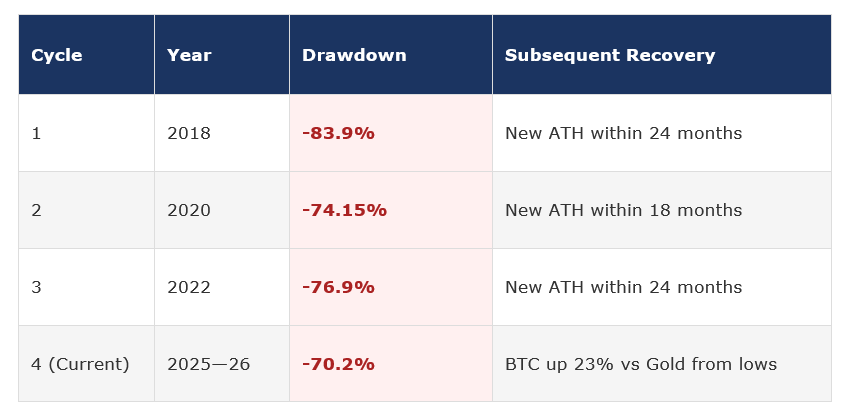
In the three instances before the current drawdown, the ratio eventually recovered and then some, producing a new all-time high within 18 to 24 months of the trough.
The current drawdown, clocking in at approximately 70.2%, falls squarely within this historical range.
Just as important is the fact that no prior drawdown of this magnitude resulted in a sustained breakdown to new structural lows without a significant intervening recovery.
This macro framing matters for interpreting near-term signals.
A 70% drawdown in a structurally bullish asset that has never broken its long-term uptrend is a very different trade than a 70% drawdown in a deteriorating one.
This makes the multiple signals around the BTC/Gold ratio a potential re-entry point into the dominant long-term trend.
The current setup has already fired the first confirming shot: BTC has gained approximately 23% against gold from its recent lows. That suggests the trough is either in or very close.
2. Harmonic Bat Pattern.
Layered on top of the historical pattern is a textbook harmonic bat formation.
This pattern requires specific proportional relationships between each swing leg based on Fibonacci retracement levels. Which you can see below with the D-leg completing at the 0.886 Fibonacci retracement.
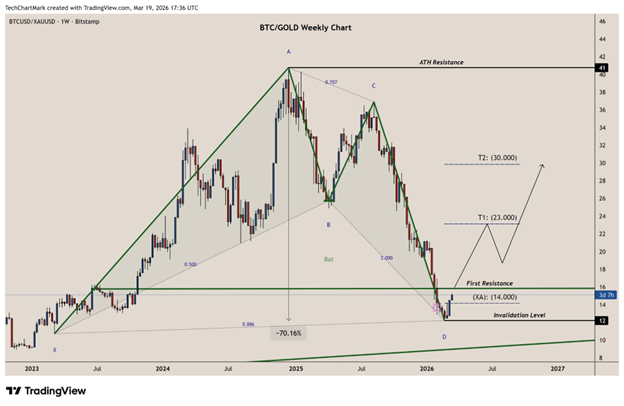
This is not incidental chart noise. It is a structurally independent technical signal. One that’s converging at the same price zone as the historical drawdown floor.
Giving us our second confirmation.
3. Momentum Indicators: Weekly RSI at Cycle Lows.
As I write, the weekly RSI reading is at levels comparable to the 2018 and 2022 cycle lows on this chart. Both of which preceded substantial multi-month recoveries in the ratio.
This indicator doesn’t mean a rally is imminent. But it does reinforce the conclusion that another downturn is unlikely.
Bottom Line
The BTC/Gold ratio is presenting one of the more technically coherent long setups in the macro crypto space. All while gold's own technical posture introduces a potential mechanical tailwind for the ratio.
Together, the historical drawdown depth, harmonic Bat completion at the 0.886 Fib and oversold weekly RSI represent three mutually reinforcing signals arriving simultaneously at the same price zone.
The probability of this being coincidental is low.
More likely, all are reinforcing what cycles expert Juan Villaverde has been saying throughout March …
Bitcoin is ready to run … as soon as the geopolitics allow.
And if you’re interested, you can get a peek at how Juan is preparing his Weiss Crypto Investor members for that run here.
Best,
Mark Gough