 |
| By Juan Villaverde |
Crypto asset prices rolled over this week. Monday marked the start of what looks like a new 80-day-cycle correction.
To us, this was not unexpected. In fact, I warned you that additional volatility could be in the cards last Friday.
With my Crypto Timing Model highlighting Oct. 17 as a near-term low, it’s likely this pullback will continue until then.
To be clear, this doesn’t mean the end of the bull market. The bull run is still alive. It’s just taking a breather.
But I was a bit surprised to see a lot of analysts caught off guard.
And that’s probably because they’re relying on a widely used — but seriously flawed — Global M2 liquidity chart for their forecasts.
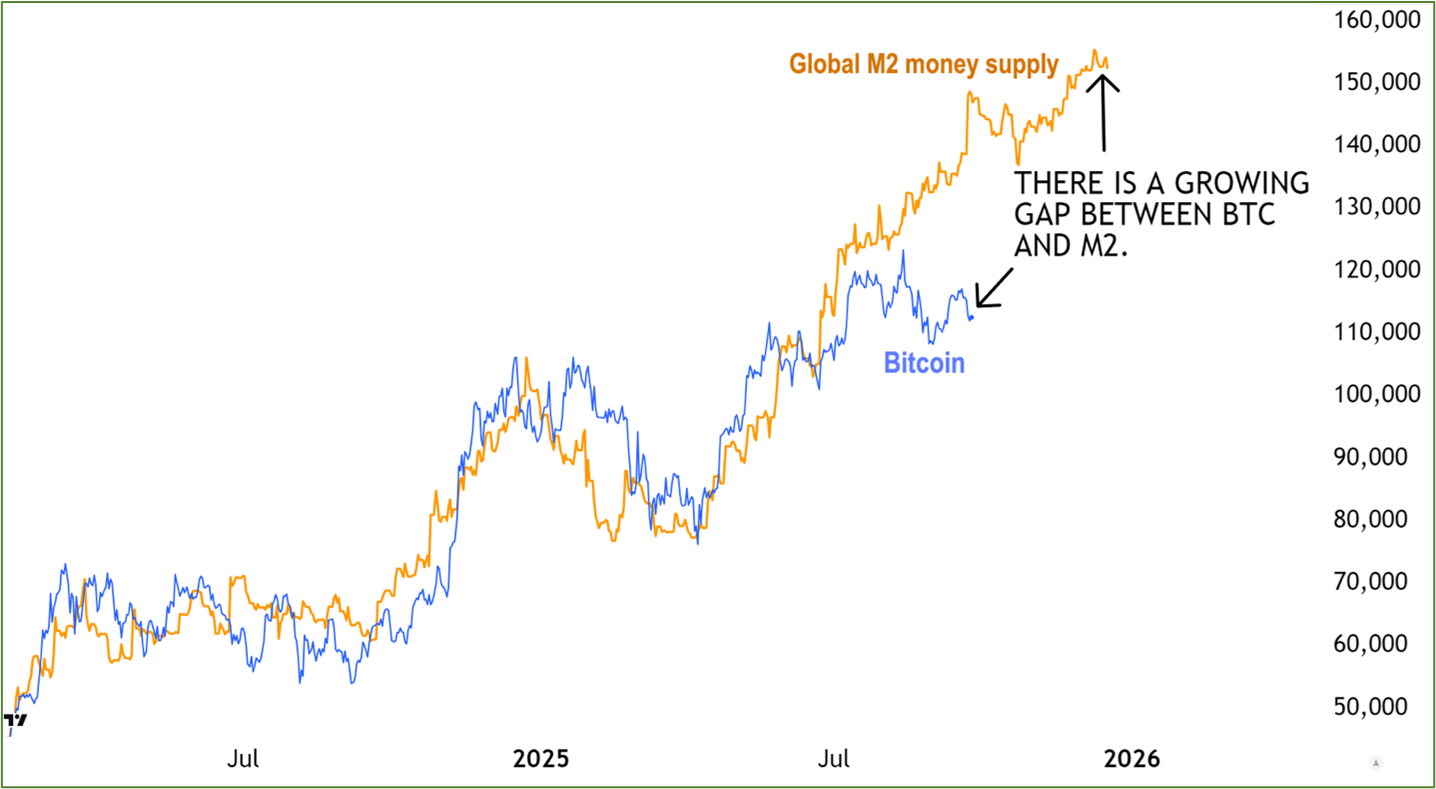
The problem is … Bitcoin (BTC, “A-”) and M2 are presently marching to different drummers.
BTC and M2 Go Their Separate Ways

As you can see, if Bitcoin really followed Global M2, it would be much higher — near $140,000 today. And on its way to $160,000 by early December.
Instead, Bitcoin has basically been flatlining for months. Despite reaching a new all-time high back in August, BTC has erased those gains and is trading back at levels last seen in early July.
And the wider this gap gets, the more obvious it is that the M2 model must be seriously flawed. To stubbornly continue to embrace it … looks less like empirical analysis and more like blind faith.
Sure, M2 was once an excellent predictor of Bitcoin prices.
But that was back when central banks drove the lion’s share of M2.
Nowadays? Not so much.
So, why do so many still cling to the belief that Bitcoin is destined to follow M2? Well, crypto markets are more nuanced than a lot of analysts grasp.
Let me show you what I mean by this.
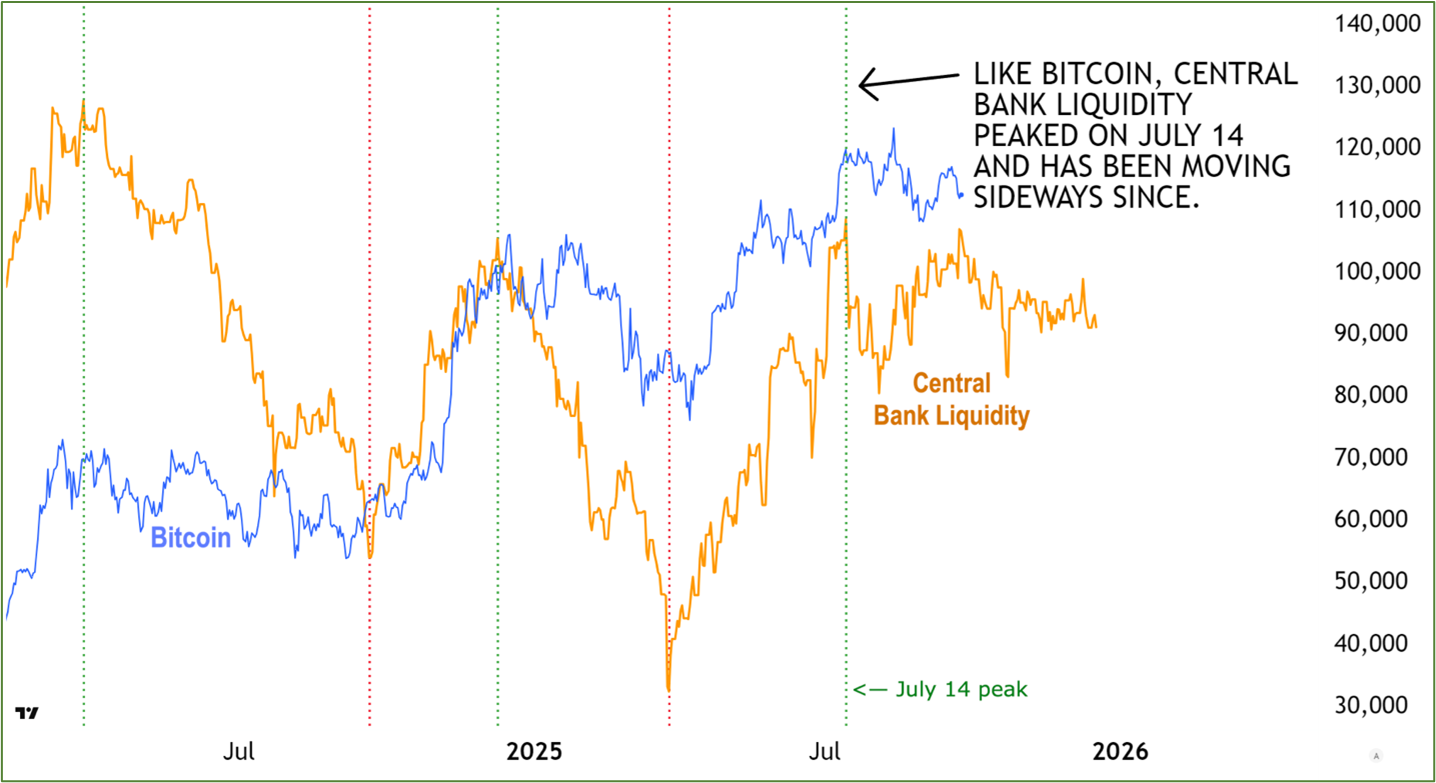
Below is another version of the Bitcoin-versus-liquidity chart. Only instead of using Global M2 to measure liquidity, it uses my preferred Central Bank Liquidity (CBL) indicator.
CBL Makes a Better Bitcoin Predictor

Now, here’s the nuance. Admittedly, at first glance, CBL and Bitcoin don’t look that highly correlated.
That’s why I’ve added the dotted vertical lines (green for tops, red for bottoms). Now, zoom in on the price action between these vertical lines.
- Notice how Bitcoin only rises when CBL rises. And only falls when CBL falls.
- Most notably, CBL peaked on July 14 (marked by the rightmost green vertical dotted line). And has shown no signs of recovery since.
One further observation: Even though CBL and Bitcoin rise and fall together (above), Bitcoin tends to rise more and fall less than CBL suggests.
Like I said, it’s nuanced.
Why is Bitcoin stronger than CBL alone would imply?
Well, it could be strong institutional demand since the BTC ETFs were approved. Or it could be corporate buying.
It could even be that M2 still influences crypto after all … but the relationship isn’t 1:1.
Regardless, one thing is still abundantly clear … even if we cannot answer this question precisely: Bitcoin will not rally if CBL continues to flatline the way it has since July 14.
The takeaway: Crypto is in no rush to go anywhere.
As mentioned, my Crypto Timing Model has Oct. 17 pinned as the next key low for crypto. That makes it a likely endpoint of the correction now getting underway.
Which means we’ve got a bit of a wait before Bitcoin has the chance to continue its up move.
That’s ok. Remember, nothing can go up in a straight line. And healthy corrections in a bull market clear the way forward.
The bull market lives. Crypto isn’t broken. But the popular M2 model frequently used to predict it … is.
That’s why I don’t rely on it in my analysis.
Instead, I combine my Crypto Timing Model — which has accurately called the past three long-term cycle highs and lows — with indicators like CBL and gold to more accurately see what’s around Bitcoin’s bend.
You can see for yourself how it works and learn how it can help boost your long-term crypto opportunities here.
Best,
Juan Villaverde

