 |
| By Juan Villaverde |
Last week, crypto markets made a significant low on Oct. 17 — exactly as my Crypto Timing Model forecast months ago.
Bitcoin (BTC, “A-”) tumbled to just under $104,000 and then rallied sharply over the weekend and into this week. By Tuesday, it hit a high of $114,000 before retreating in the same trading session.
As I write, BTC hovers near $108,500 — just above the 80-day-cycle low made on Aug. 29.
That low is critical: Bitcoin cannot cross below it. Because doing so would signal that a prolonged decline is underway.
Why am I so confident about the Oct. 17 low? Two reasons:
- It had the second highest “intensity” reading on my Crypto Timing Model so far this year. (The highest was April 7, Bitcoin’s last confirmed 320-day-cycle low.)
- My strongest forecasts come when cycle timing and liquidity align. When they both point to the same turning point, we get the most meaningful inflections. And that’s exactly what happened.
Global M2 (the world’s stock of money and credit), Central Bank Liquidity (CBL) and Asian Liquidity (AL) all pointed toward the same outcome: a correction between Sept. 23 and Oct. 23.
And we got it.
However, things got a little tricky after my model’s Oct. 17 low. Because these …
Previously Aligned Liquidity Gauges
Took Off in Different Directions
CBL and AL are the most useful liquidity gauges for forecasting Bitcoin’s price path. And they will be our primary tools, going forward.
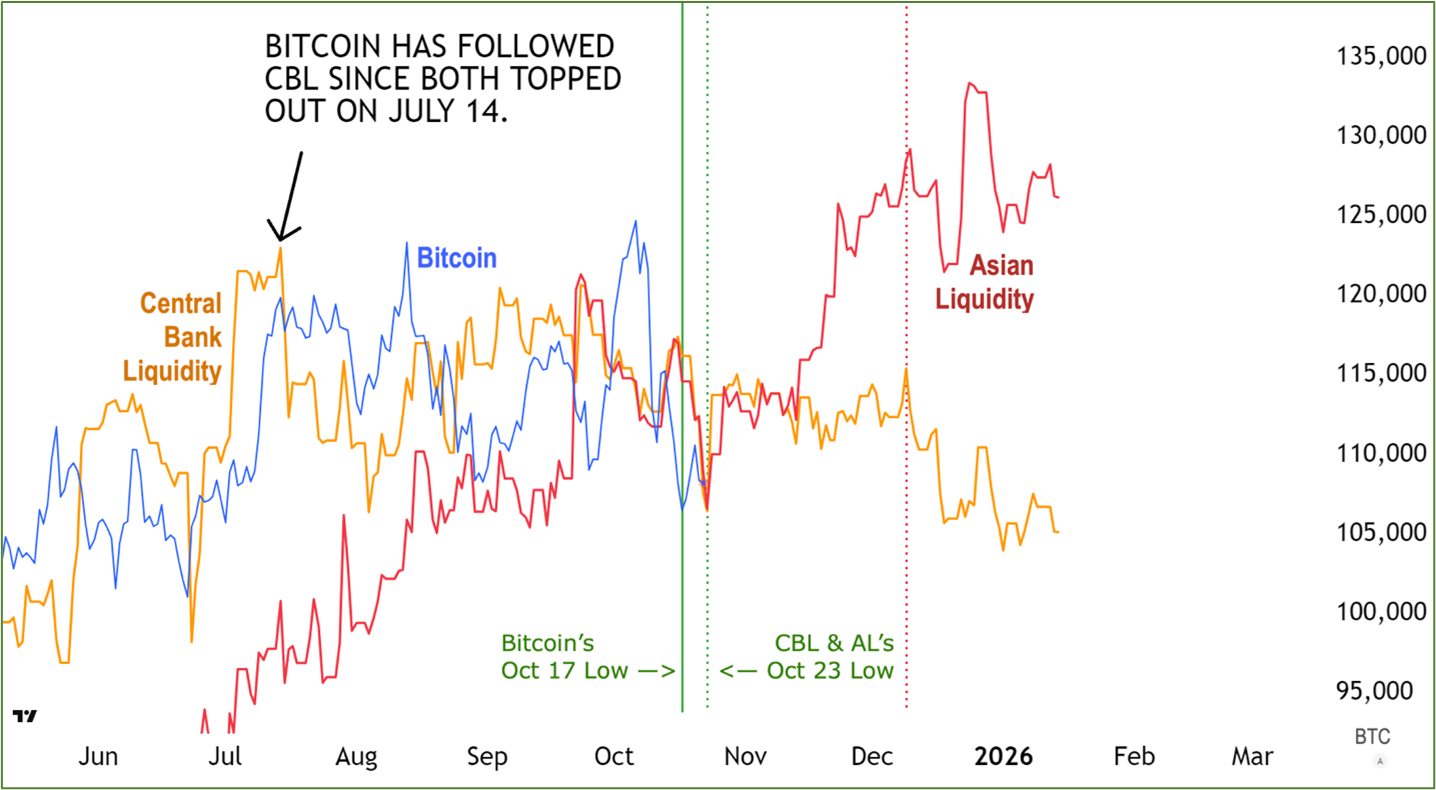
- Note the meaningful low Bitcoin made on Oct. 17 (the solid green vertical line).
- Observe how CBL and AL both fall into a low around Oct. 23 (the dotted green vertical line).
- But see what happens afterward: CBL flatlines — pointing to new lows by late November. While AL points to a rally into new all-time highs over the same time frame.
What makes this even more interesting is this: Historically, Bitcoin normally tracks AL more closely than CBL. But since its July 14 high, Bitcoin has been trading pretty much in lockstep with CBL … and nothing else.
This matters.
Because if this correlation holds, we likely won’t see prices hit a new top this year.
The good news is this: AL shows a strong rally three weeks from now.
Bitcoin will either follow suit or not. Either way, we’ll have our answer soon.
In the meantime, savvy investors should take stock of their portfolios and prepare two strategies — one in case Bitcoin follows CBL, and one in case it follows AL.
This way, you’ll be ready no matter what the market throws our way.
And if you want to see how my Weiss Crypto Investors will navigate this volatility, click here.
Best,
Juan Villaverde
