 |
| By Juan Villaverde |
Going into this week, I thought the biggest story in crypto would be the U.S. - Iran peace talks in Islamabad.
And it was. But the impact on the markets played out in a very unexpected fashion.
During "21 hours of discussions" Vice President J.D. Vance presented a “best and final offer.” Which Iranian negotiators were not prepared to say “yes” to. So, Vance flew back to Washington without a deal.
Bitcoin (BTC, “B+”) — the only market open at the time — sold off immediately on the news. That was expected considering the outcome.
What came next, though, broke the mold.
Because when the markets opened on Monday, oil sold off sharply. And Bitcoin and stocks rallied on news that President Trump would impose his own blockade of the Strait of Hormuz.
That means there are now two countries formally blocking this key waterway — through which 20% of the world's oil flows.
Not only that, but Iran also threatened to block shipping from the Red Sea, as well, further escalating their response.
These are curious developments for markets to celebrate as good news!
I have a somewhat different view on what’s behind the market’s wonky response. But more on that in a moment.
In the meantime, here’s a more detailed view of the three key benchmarks.
Bitcoin, Stocks & Oil after Peace Talks Fail
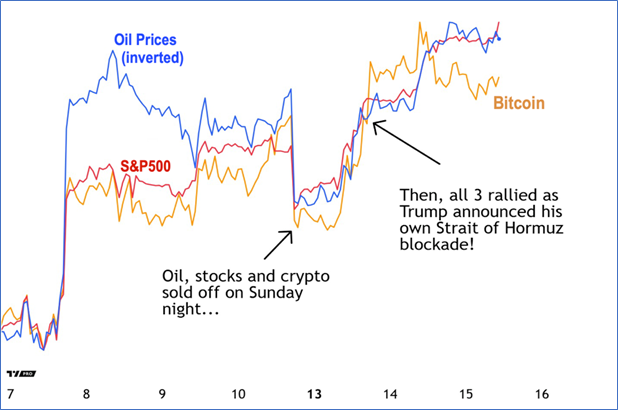
All three moved up sharply moves on Monday, as the United States Navy imposed its own naval blockade. The relevant event sequence:
- Trump backed away from his threats of "ending" Iranian civilization.
- He then announced a ceasefire followed by peace talks.
- When talks broke down, he imposed the blockade to pressure Iran into a deal.
- Iran expressed openness to negotiate further, but is also threatening more blockades if necessary.
In what might aptly be described as "shotgun diplomacy," both sides are re-engaged in dialogue. Because they both want a deal. But neither wants to lose face. So, they embrace ongoing military pressure as a form of leverage.
It's actually a delicate, tenuous state of affairs. But still enough to convince a lot of market participants to wager an actual, permanent solution is right around the corner.
The price action in the S&P 500 is particularly telling. It managed to set a new all-time closing high on Wednesday.
S&P 500 Stock Index
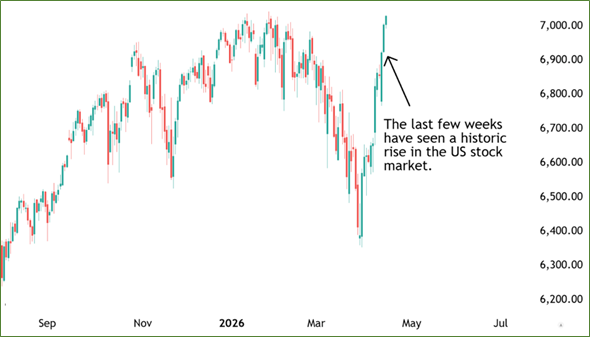
The move was triggered by a historic short squeeze, as traders and hedge funds were positioning themselves for “certain doom.”
“Never bet aggressively on the end of the world” … seems to be the lesson here.
In sharp contrast to the S&P 500, Bitcoin's reaction to the same series of Mideast events … has been far, far more timid.
Bitcoin’s Lukewarm Response
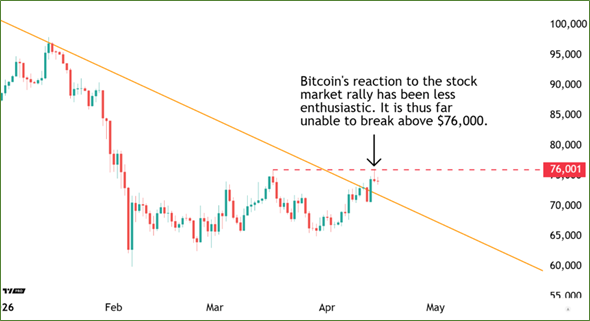
Bitcoin staged a phenomenal relief rally on Monday as global markets opened. But it has been flat ever since. And this muted price action sharply differs from oil and stocks.
Oil sold off sharply every day since. Stocks have rallied every day. But Bitcoin meanders mostly sideways.
How should we make sense of this?
Well, observe the dashed red line (above) which marks the $76,000 level. This is where Bitcoin topped out, during one of the most intense weeks of the war. After briefly touching this level on March 17, it reversed sharply into a low at $65,000 on March 29.
Why does this matter?
Because traders looking at charts and patterns see this and go short. That is, they bet that Bitcoin will fall back to the $60,000s or even lower. Just like after March 17.
This looks like a no-brainer to so many traders that the price action in crypto right now is technical-driven. No macro or geopolitical factors are behind it. It's strictly traders betting on ongoing price weakness.
But I am not among them.
I do not think Bitcoin is going very much higher than where it is today. But there is still ample momentum — at least for the next week — for a tradeable move up.
Moreover, every model I have shows that prices are mostly bullish. More likely than not, Bitcoin will march higher into a final high.
Last week, I suggested that would be between April 20-21. That’s when my geo-cosmic model and Japan’s M2 indicator, respectively, say that a high should come in.
But another indicator — Central Bank Liquidity — is showing a second potential high sometime around May 9.
Japan’s M2 has been the outlook BTC’s price has followed. But CBL has been a more accurate predictor of significant highs and lows.
So, I expect we’ll see a double top form between late April and early May. That’ll be our next 80-day cycle high.
For traders, this means there is still time to enjoy these rising prices.
But for longer-term investors, it means there’s a better buying opportunity later this year. My models indicate that’ll come sometime between July and August.
That is, once this 80-day cycle ends, and the next one begins. That’s because that should coincide with one of the last 80-day cycles of the crypto winter.
To see how my Crypto Timing Model — and all the indicators I follow — can help you nail down that window of opportunity, click here.
Best,
Juan Villaverde
