 |
| By Juan Villaverde |
It’s one thing to have confidence in your analysis and market strategy. It’s another feeling altogether to have them validated in real time.
And that’s exactly what happened this week.
In June 2025, I pointed out an incredible correlation between the market peaks and valleys identified by my Crypto Timing Model …
And geopolitical events that shake the market.
That correlation didn’t go away. This week confirmed it’s still in play.
First, the backdrop.
I’ve been saying for weeks that crypto’s macro outlook is bullish. But Bitcoin (BTC, “B+”) can’t go higher until the action in Iran cools and oil prices fall.
I don’t expect the war to just go away with a handwave. More likely, I said we should expect a small reprieve. A temporary stop to the action that would give the markets room to breathe.
On Feb. 19, my model identified a key, near-term low would fall between April 5-7.
Now, after weeks of fear, postponed deadlines and dark rumors of deals not confirmed, President Trump announced a two-week ceasefire on April 7.
Not only does that hit directly within the window my Crypto Timing Model identified as the low …
It’s also the very date my Japan M2 indicator identified as a critical crypto market low — roughly two months ago.
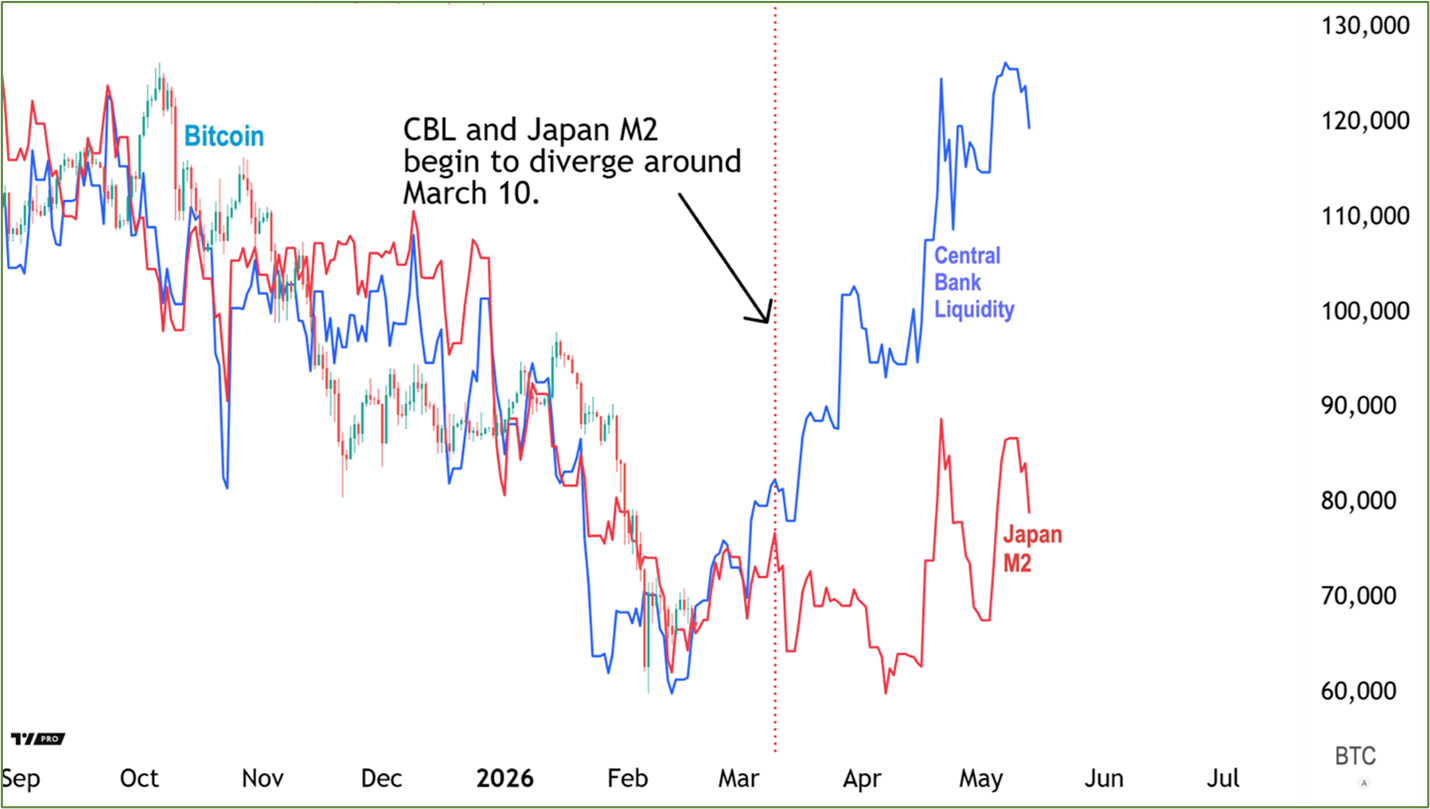
Back in February, I told you how Japan’s M2 diverged from Central Bank Liquidity. Both indicators showed a rally ahead, but with very different strengths.
And I said it looked like Bitcoin (BTC, “B+”) was set to follow Japan M2 into a more subdued push higher.
And it sure didn't disappoint!
Of course, Bitcoin’s actual low occurred last week (March 29). But April 7 was the real ignition point for its sharp move up.
And as you can see below, crypto was far from the only asset class riding this particular shockwave higher.
War’s Highly Correlated Price Action
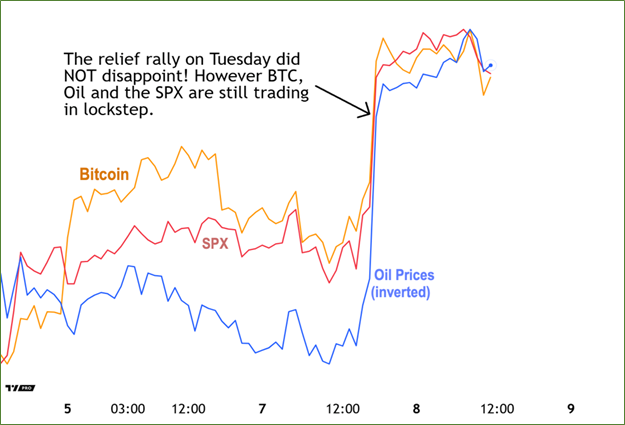
All three assets moved together, rising sharply as news of a two-week ceasefire followed by peace talks hit the wires.
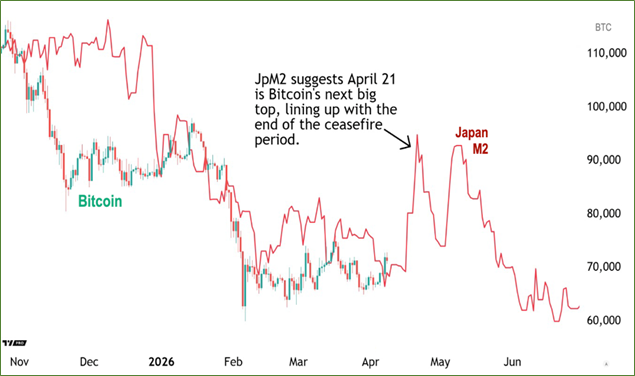
Plus, two weeks from April 7 is April 21.
In the same update where I showed you Japan M2 diverging, I said that the rally would go through late April.
Now, Japan M2 is highlighting April 21 as the next critical top for Bitcoin.
When Bitcoin Likely Tops Out
What we have here is an extraordinary confluence of events:
- The ceasefire ends on April 21.
- My geo-cosmic-based forecasting model predicts the next major high on April 20.
- The only macro model that priced in the hostilities, Japan M2, also points to a top on April 21.
Accordingly, what we're looking at … is likely not an end to the Iran War, as many are now celebrating. But merely a pause in hostilities.
Which could resume in the not-too-distant future.
Be that as it may, it certainly looks like late April is when the next critical top will take place.
And that means we should have solid two solid weeks — maybe slightly more — of mostly bullish price action.
Even my short-term models that track the 20- and 5-day cycles point to this.
The macro picture is as bullish as I've seen it in years. Since late 2022, in fact. Plus, there are growing indications the CLARITY Act (the crypto market structure bill) may finally be signed into law by President Trump by the end of April.
All these things point to crypto markets rallying, at least into late this month.
From there, things get murky. Especially as we wait to see how the situation in the Middle East unfolds.
Fortunately, my indicators will be able to help us navigate through it.
And if you’re interested in learning how my Crypto Timing Model’s specific “buy” and “sell” signals can help you pinpoint the best times to enter and exit this crazy market, you can watch my latest briefing here.
Best,
Juan Villaverde
