Bitcoin Started 3 Midterms Beaten Up. Not This Time.

|
Key Takeaways
|
 |
| By Beth Canova Reviewed By: Dawn Pennington |
Every two years, the same thing happens on Wall Street.
The ads get louder. The polls get closer. And a lot of investors sit on their hands until the votes are in.
Then the fog lifts. And more often than not, stocks go up.
Today is one of those days. Polls are open across the country for the midterms. But this time, there is a new twist …
Bitcoin (BTC, “A-”) walked into Election Day in a spot it’s never been in before.
For the first time in four midterm cycles, Bitcoin is trading above its 200-day average.
Now, that alone does not tell you where it goes next.
But it does tell you this cycle is starting from a very different place than the last three.
What the 200-Day Line Means
The 200-day moving average is one of the oldest tools in Wall Street’s kit. It takes the closing price for each of the last 200 days and average them.
The result is one smooth line. You can use it to see whether an asset can maintain its strength. That’s useful when you’re looking for entry or exit points.
Think of the 200-day as the trend's spine.
Prices above the line means buyers have had the upper hand for months. Prices below it means sellers have.
Big Wall Street funds watch this line on stocks, gold and oil. Many run rules off it.
So when an asset sits above it — like Bitcoin does today — then the trend is on its side.
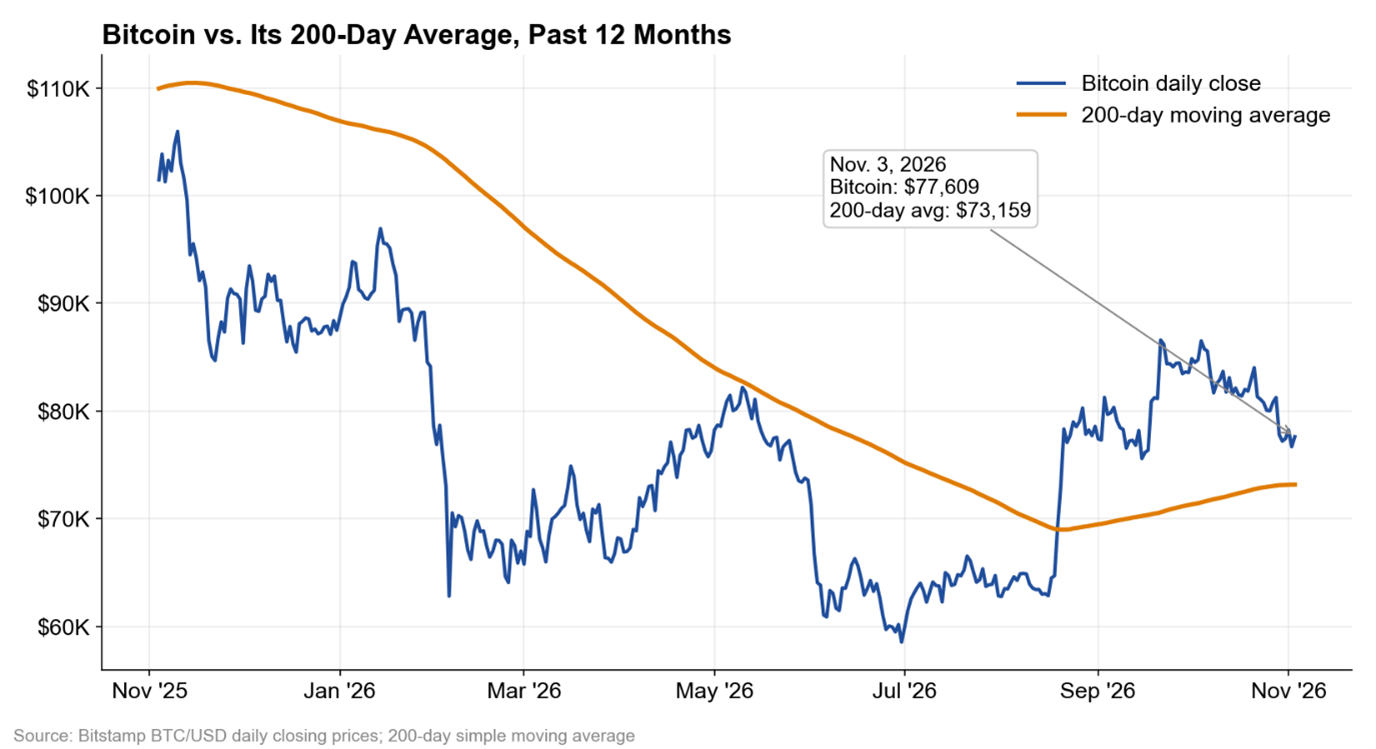
This is the first time in Bitcoin’s history that this has been the case.
Three Midterms Below the Line, One Above
Here is where Bitcoin stood on each previous midterm Election Day, based on daily prices from the Bitstamp exchange:
- 2014: $330, about 35% below its 200-day average.
- 2018: $6,448, about 9% below.
- 2022: $18,550, about 22% below.
In all three past cycles, Bitcoin came into the vote beaten up.
Those were also brutal years, not just Election Days.
Bitcoin fell 56% in 2014, 73% in 2018 and 64% in 2022, by the count of Binance Research.
This year has been rough, too.
Bitcoin is down about 27% over the past 12 months. It sits about 38% below its peak of $126,080 from October 2025.And yet, it has done something none of those years did …
It climbed back above its trendline and stayed there into the vote.
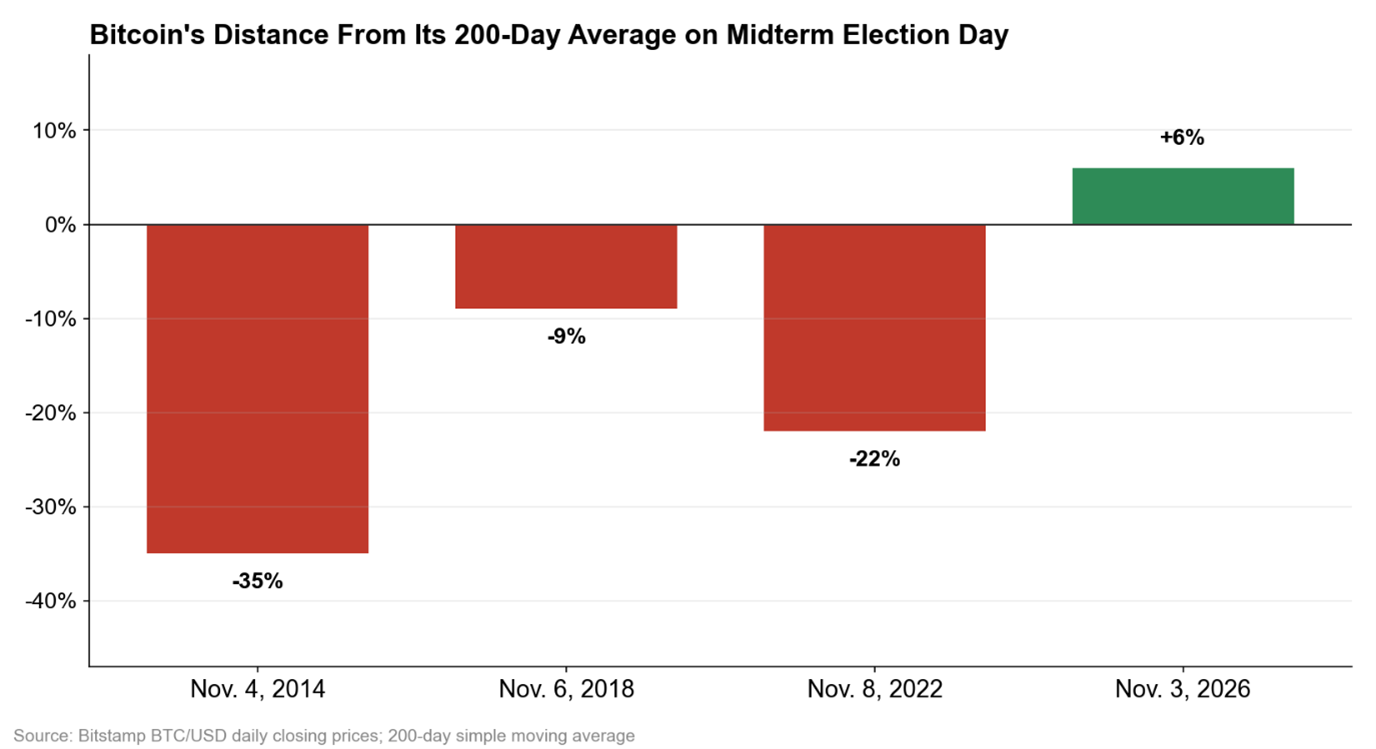
At the time of writing, BTC trades near $77,600, roughly 6% above a 200-day average near $73,200.
And it held there through a real shock.
On Oct. 29, hackers took about $6.3 billion from Binance, the world's biggest crypto exchange. It was the largest crypto theft on record and it pushed BTC to a six-week low near $76,400.
But it never broke its 200-day line.
History suggests Bitcoin could remain elevated in the short term. Why?
Stocks Tend to Rally After Midterms
Not always, but often enough that it has become one of Wall Street's best-known patterns.
How often depends on how far back you look.
Go all the way back to 1874, and the S&P 500 Index was higher 12 months after 32 of the 38 midterms since then.
That is 84% of the time, with an average gain of 14%.
Start the clock later, and the record gets better. Fidelity's study from 1938 puts the win-rate at 95%.
And Capital Group found no negative 12-month return after any midterm from 1950 on.
So "about nine times out of 10" is a fair way to put it.
Why does it happen? The leading theory is simple: Markets hate not knowing. A midterm ends a long stretch of guessing about who will run Congress for the next two years.
Once the result is in, investors can plan again. And a split Congress often means fewer big surprises out of Washington.
How Much of That Market Momentum Carries Over to Crypto?
This is where you need to be careful. Stocks have more than 20 midterms of history. Bitcoin has three.
That is not a pattern. That is a handful of coin flips.
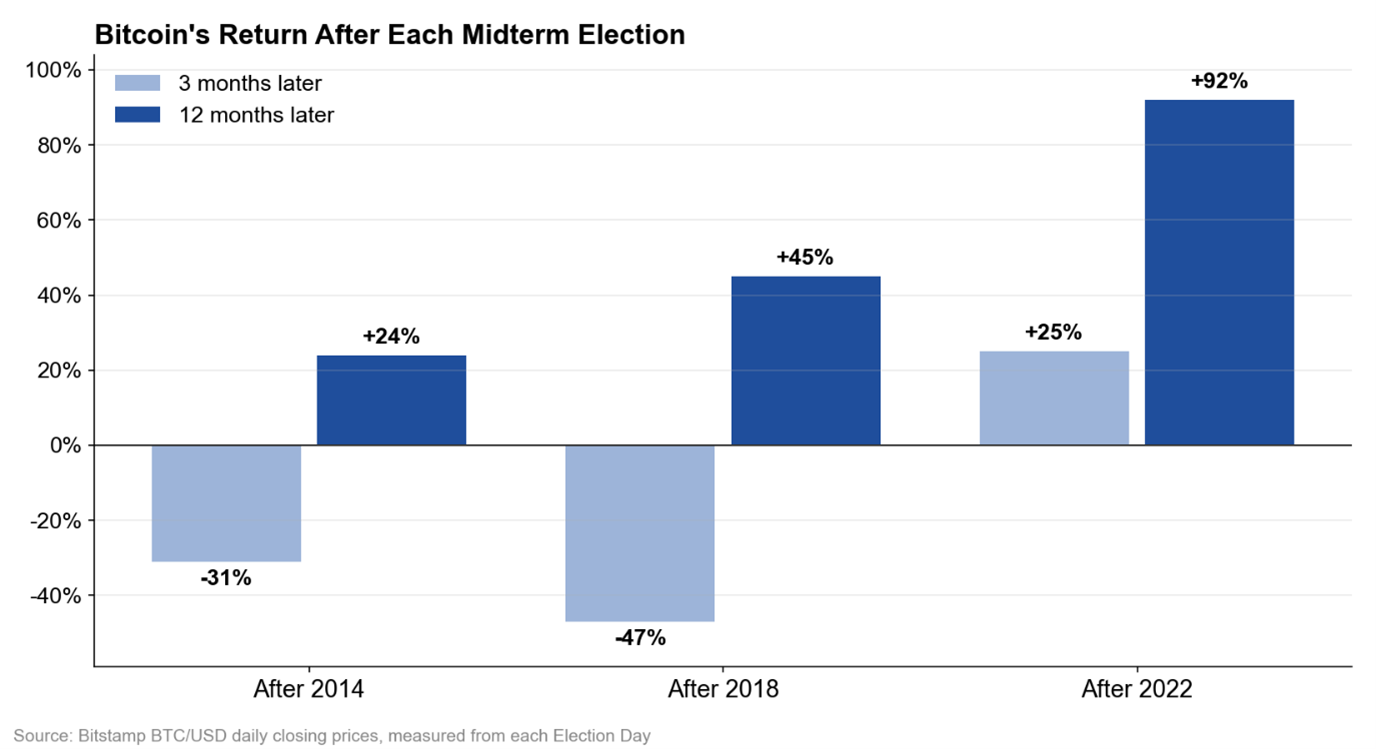
Still, those three cycles all pointed the same way. One year after each midterm, Bitcoin was higher:
- After 2014: up about 24%.
- After 2018: up about 45%.
- After 2022: up about 92%.
Binance Research put the average post-midterm gain at 54%.
But a year is a long time. Which is why it’s important to look at the path, not just the end point.
The first few months following the elections were often ugly. Three months after the 2014 vote, BTC was down 31%. Three months after the 2018 vote, it was down 47%.
In both cases, patient investors were paid. Nervous ones were shaken out first.
There is one more catch that’s important to note: Bitcoin's midterms have lined up with its own four-year rhythm.
Every four years, the number of new coins created is cut in half. That event, called the halving, landed in 2016, 2020 and 2024.
Each of the last three midterms fell 17 to 20 months before the next halving.
So, it is hard to say how much of those gains came from the vote and how much came from Bitcoin's own clock.
That comes into play when we start to look at …
Why This Midterm Cycle Is Different
In the past, Bitcoin went into the vote deeply oversold. Part of the rally after was a bounce off the floor.
This time, it is not at the floor. It is above its trend.
That can cut both ways.
The good news is that the trend is already on its side. Bitcoin does not need to dig out of a hole first.
The risk however is that there is less room for a "relief" bounce.
If the bull case is already in the price, the post-vote pop could be smaller than in past cycles. And a break back below the 200-day line, near $73,000 today, would erase the one thing that makes this midterm special.
Other risks are real, too: A surprise midterm result could rattle stocks. And BTC still tends to fall harder than stocks on bad days.
Rate moves from the Fed matter more to crypto than any one vote.
What to Watch from Here
You do not need to guess the winners tonight to use any of this.
Watch the 200-day line. It is the clearest sign of whether this midterm really is different. Bitcoin's line sits near $73,000 and rises a little each day.
Any free charting site will draw it for you. From the Weiss Ratings website, you can click on Technical Chart, +Indicator and Simple Moving Average. Then type in 200.
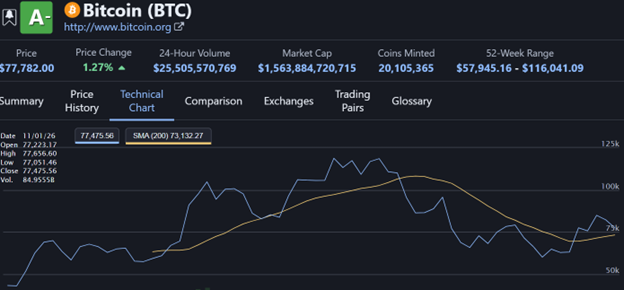
If price holds above the 200-day in the weeks after the vote, the trend that history favors is still in place.
If it breaks below and stays there, this cycle starts to look like the old ones, with the rough stretch first.
And if you plan to add crypto because of the midterm pattern, size it for the worst case in that table, not the best.
A 47% drop in three months has happened before. If you couldn't sit through that, the 12-month number won't help you.
Alternatively, you may want to save your seat for my colleague Juan Villaverde’s upcoming crypto briefing on Tuesday, Nov. 10 at 2 p.m. Eastern.
In it, he’ll tell you how his Crypto Timing Model finds the best time to enter and exit crypto’s fast-moving opportunities.
Best,
Beth Canova