Did you leave money on the table?
The goal of investing is to put your capital wherever it will be most rewarded. If you aren’t … if you’re leaving your money in assets that are underperforming … then you’re leaving money on the table.
In this latest Weiss Crypto Sunday Special, Chris Coney shows you how to maximize your returns and how to analyze for yourself if your money is really working as hard as it could.
For the full transcript, read on ...
Chris Coney:
Hi there, guys, and welcome to this edition of the Weiss Crypto Sunday Special with me, your host, Chris Coney. So, today's topic, then, is did I leave any money on the table?
So, let's start here with this: The goal of investing is to put your capital wherever it will be most rewarded. Now we might have other considerations such as risk or even nonmonetary considerations like the ethics of what we're investing in, but I want to focus on the first principle today, which is the idea that we want to put our capital wherever it's most rewarded.
Now [that] we've established that, here's the next point. I'm sure you've been in this situation more than once, especially when it comes to crypto. Number one, you have a position in a crypto asset and it's underperforming. Number two, you identify another asset that you believe will perform better. Number three, you go through the process of transferring your capital from the first crypto asset into the second one.
Now one quick point of accounting there: If I were to do this, I would probably sell the first crypto asset into a dollar stablecoin, and then buy the second asset with those dollar stablecoins. And this ensures that I get two entries in the trading log on my exchange, and each one recording the dollar value of the sale and the buy.
Not only is that important if you need to refer back to it later for your own sake, but it's also useful for tax reporting purposes. I mean, especially in the U.K., when you trade one asset for another, it's as if you sold it in the way that I just described.
So, you have to record the fiat value of the asset you sold, and then account for that separate to the one that you buy, even though you went directly from one asset to another.
The only downside with doing it my way — selling it into dollar stablecoins and then dollar stablecoins into the second asset — is that you pay two trading fees. But considering exchanges like Binance charge 0.075% fee … for some, like me or maybe you, it might be worth it for the ease of reporting.
So, let's say you took a trade like this. Let's actually use a real example for one of my students. They had a bunch of EOS (EOS, Tech/Adoption Grade “C”) that they bought a while back when I was a massive fanboy of EOS, and that position was way, way underperforming. So, on Nov. 15, 2021, they converted half of their EOS holdings into Ethereum. And this is because one of the investing rules that I teach people is never deploy 100% of your capital into a position in one go, and never sell 100% of your position in one go.
Now, the reason I have that rule is that it leaves it open for you to be wrong and still win, which means if you sell all of the position and then it doubles afterward, bad. Whereas if you sell half of it and it doubles, the half you didn't sell still goes up double.
So, the question, and the whole point of this episode, actually, is: Was that a good decision, and how do I find out? Was that a good decision to trade one asset for another? And how do you even find that out?
My answer to that is to use a combination of tools provided by TradingView, which is an online charging software that has pretty much become the industry standard for crypto investors, and it's the one I personally use exclusively.
So, I'm going to actually share my screen with you now and show you this step by step.
This is TradingView. So, the first thing I'll do here is I'll pull up the EOS/USDT chart. This one here. This is EOS/USDT.
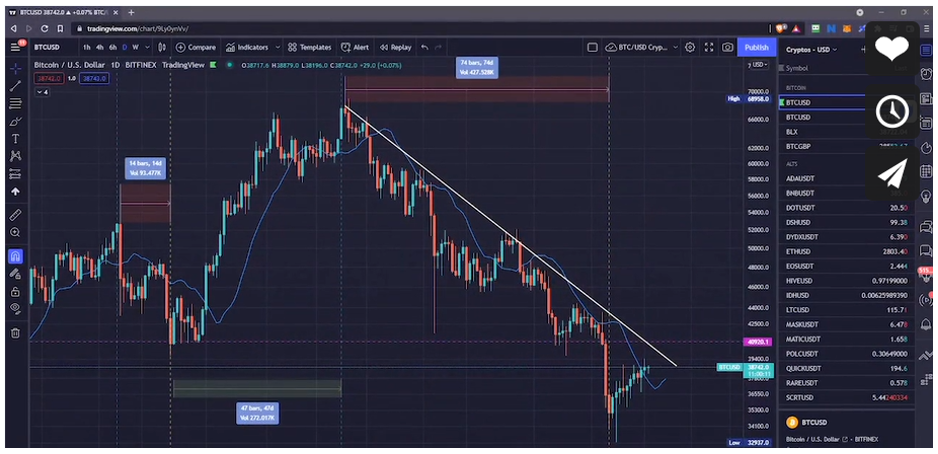
So then what I'll do is, I'll turn off all the drawing tools, because we don't need any of those. That's that one. I'll turn off this blue moving average for the time being. Don't need that; I just want the pure price. Then what I'll do is I'll change the candlesticks to display the price as a line. So I'll want line. There we go.
And then next thing I'll do is I'll change the price to a percentage, like that. Then what I want to do is, I want to make the 15th of November 2021 the date on the very far left of the chart. Remember that was the date my student decided to swap half their EOS for Ethereum (ETH).
And I could do this by entering a custom date down here. So this is 2021, that's the month. So instead of 8, I'll put 11, and then instead of 13, I will put 15. So this will show the price action from 15th of November, 2021, all the way up to today. Like that.
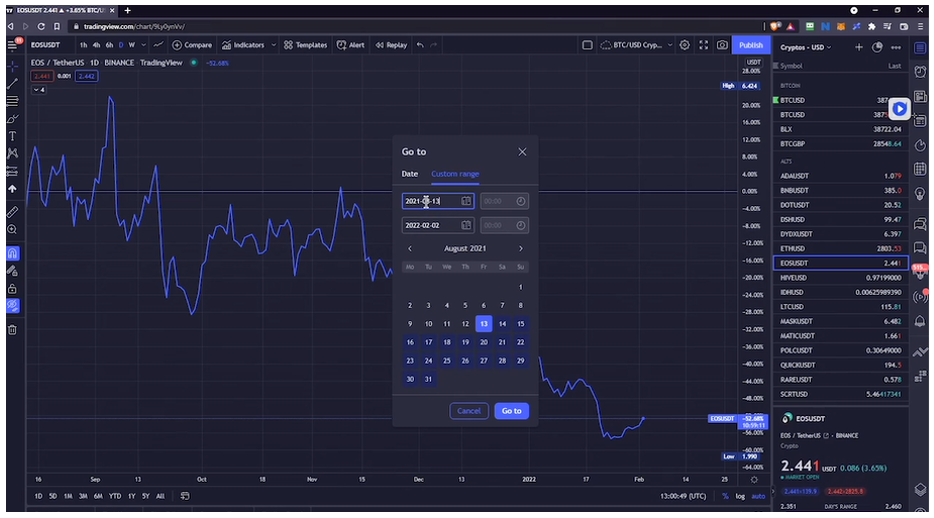
So this gives us the price performance of EOS since then, and as you can see, it's down quite a bit. The reason we want to put that date on the far left is that that becomes the zero line, as you see here.
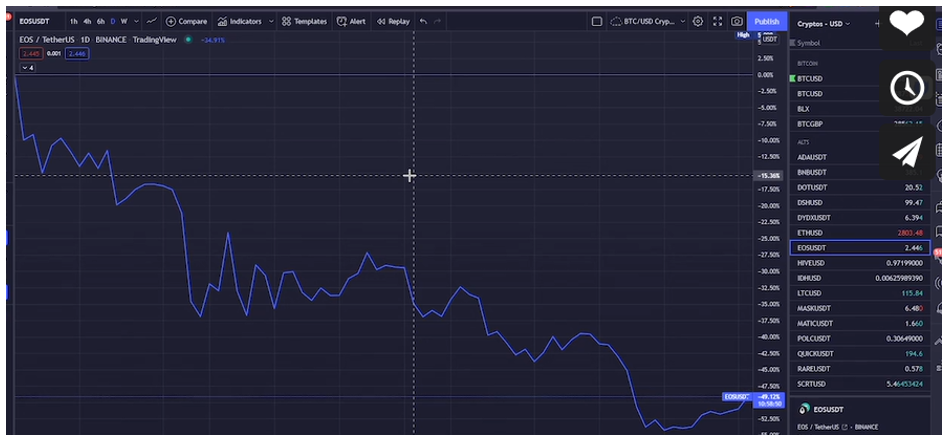
And then that whoever the price was on that day was the baseline. So from the baseline is now down 49.16%. So, there we go.
So now what I'll do, I want to click the compare button up here. This is the combination of tools we're looking for. And what I'll do is I'll add Ethereum and I'll use the same percentage scale.
So, what that will do … that'll plot the performance of Ethereum since then. Now that's just the ... They're both blue, so I don't really like that. I'm going to change the color of this one just to make it more obvious. I'll put Ethereum in red, so it is very, very obvious which one is which. And we'll turn that cross arrow off because it's confusing.
There we go. Now I've just got an arrow. So here we go.
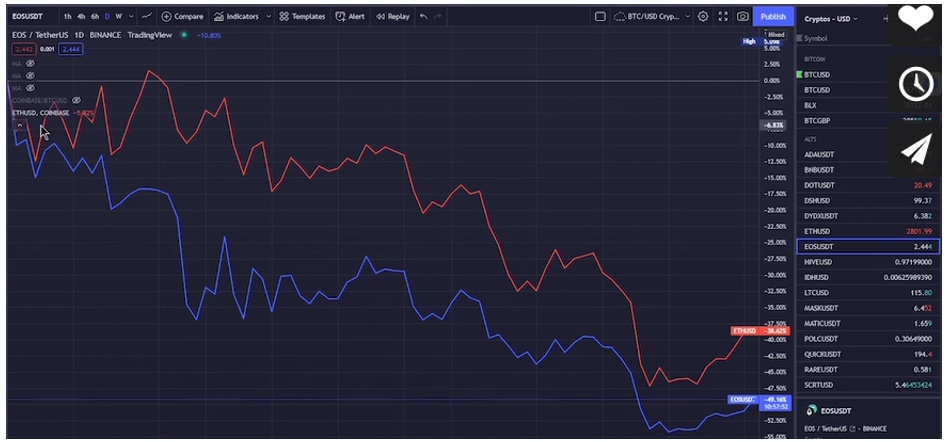
Ethereum is down quite a bit as well, because again, the baseline starts on the same day, and it's showing the Ethereum price is down as well a bit, but you can see at a glance here it has performed a lot better than EOS. The Ethereum from that baseline day is down 38%, EOS down 49%.
So, if the capital had stayed in EOS, it would be down 49% now. But half of it was moved into Ethereum, so it's only down 38%.
Now I know down is bad, but the point here is not to show the price performance of EOS or Ethereum. The point here is to give you this methodology for answering the question of whether you left money on the table or not.
So, in the spirit of that, let's do one more example that shows money actually being left on the table. It's a bit easier if the two assets are both up rather than both down.
So, let's say this time I started with dollars, instead of a crypto asset. And let's say we started on the first of July 2021. And let's say I was trying to decide between buying the Terra (LUNA, Tech/Adoption Grade “D”)asset or the Cosmos (ATOM, Tech/Adoption Grade “C+”) token.
So, let's say I opted to put it into ATOM. Let's run that methodology and see what happens. Back to the screen then.
So, if I start with ATOM, that'll be the baseline asset that I want here. So, if I type in ATOM, I can [use] ATOM/USDT; [that] will do. So now you see ATOM is the blue line, and the other one, if I pop this up, I can change this Ethereum one from Ethereum to LUNA against Tether. That's that.
The other thing I said was we were going to do this from the first of July 2021. So, it was July, seventh month. I had to figure that out then. And then this one can be the first ... So now the far left is the fifth of July 2021. That's the baseline of zero.
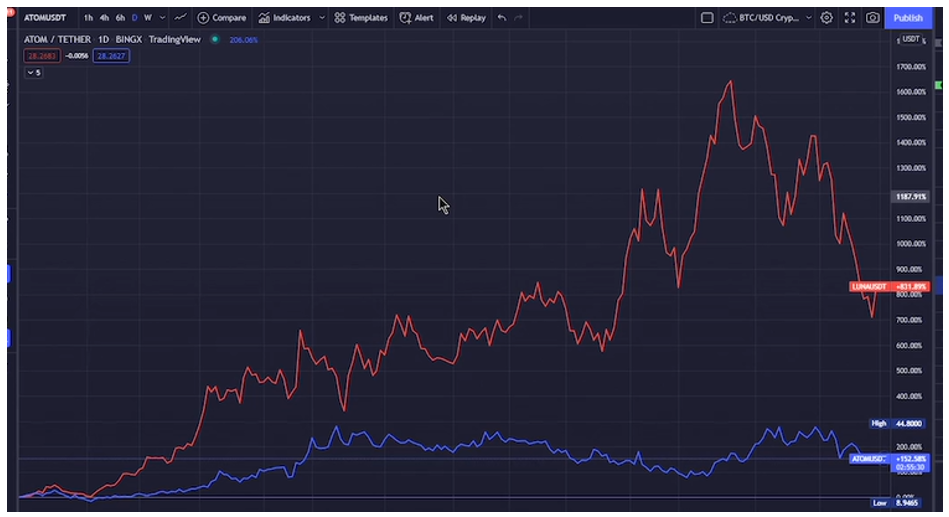
Since then both assets are up quite a bit.
So, the ATOM investment there, since the first of July 2021, if we'd have put our capital into that asset, we would be up 152.7% right now. Now that looks pretty spectacular ... until you compare it to the price performance of LUNA, which right now is up 831.7% since the first of July 2021.
So that's what I mean when I say, “Did I leave any money on the table?” Well, in this case, absolutely I did. LUNA would've been a far, far better place to put the capital than ATOM.
Now there is a risk here of this coming across as greed. I mean, if we put it into ATOM, we still made 152% on that trade, but is that not good enough?
Well, it's not a question of good enough. It's simply an objective measurement of accountability: Because you're going to have losses in investing sooner or later, you absolutely must press every dollar of capital for the maximum return to ensure that you make more money to cover the losses and then have some left over.
And this has to be the number one thing that takes people out of the trading and investing game. It's a truth that so many just can't accept, which … it ends up with them capitulating and then just handing over their wealth to a money manager who just takes them to the cleaners. In accepting that you're going to lose sooner or later, that's just something people just can't accept.
And the reason I don't particularly encourage people to have others manage their money for them is [because] my modus operandi is empowerment.
I'm regularly asked by people if I will just take their money and manage it for them. And my answer is always the same: “Absolutely not.” Wouldn't I like to earn the fees managing people's money? Of course, I would, but I'm then introducing another layer of risk to their capital — me.
I don't want your financial destiny to be in the hands of anyone else but yourself.
So hopefully what I've shared with you here today, figuring out if you've left money on the table or not, has moved you another step in that direction.
But that's going to do it for this edition of the Weiss Crypto Sunday Special. Keep a close eye on your inbox for next episode. But until then, it's me, Chris Coney saying bye for now.