How to Find the Perfect Time to Enter a Liquidity Pool
 |
| By Chris Coney |
Back in the summer of 2021, I formalized my proprietary Sideways Siphon strategy.
During that time, crypto was in a bear market. So, I refined a liquidity pool strategy that would allow me to continue to make money in down or neutral markets.
If you’re interested in checking out this strategy, it’s now accessible exclusively through my Crypto Yield Hunter newsletter.
Although I said I formalized my strategy mid-2021, that doesn’t mean it has stayed the same these past two years.
Since repetition is the mother of learning, it’s impossible for me to repeatedly use this strategy without developing, evolving and improving it over time.
Now, there’s one such improvement I’d like to share with you today.
With this one tweak, you could potentially radically improve the profitability of any liquidity position you may choose to employ.
Identifying a Liquidity Range
In a nutshell, a liquidity range is the range in between support and resistance.
So, the first step to pinpoint this range is to draw support and resistance lines on your chart that encapsulate an area of sideways movement.
Since I believe that most people should stick to providing liquidity for blue-chip crypto assets, let’s use Aave (AAVE, “C+”) as an example here:

If AAVE wasn’t moving in a sideways direction, then I would just go find another blue-chip asset that was.
After locating this range, next comes the question of when to enter the position.
This doesn’t make much difference to the yield you will earn, but it most definitely makes a difference to how much of a capital gain you come out with.
It is also a critical choice to get right in order to minimize downside risk.
You see, in the first version of the Sideways Siphon strategy, I determined the entry point to be anywhere in the bottom 50% of the range.
So, you would start by taking the distance between your support and resistance lines and divide by two. Then, you would add that to the price of your support line to determine the midpoint.
Then, as long as the price stayed between the midpoint and your support line, the entry would be valid.
In the current version of the Sideways Siphon, I have tightened this up so that I only determine an entry to be valid if it’s in the bottom 25% of the range.
The formula for this is:
- Take the distance between your support and resistance lines.
- Divide by four.
- Add that to the price of your support line.
This calculation will determine the maximum acceptable entry price, with the support line being the minimum acceptable entry price.
As long as the market is trading between these two prices, then that would give the green light to enter a liquidity position.
The logic in this approach is that we then have three times the distance above than below.
So, that means we stand to obtain a lot more in capital gains than we stand to lose.
Automating
Recently, I coded up this whole process into a one-click indicator I add to my charts.
When activated, it automatically completes all the math for me and draws a series of red, blue and green vertical lines inside the liquidity range.
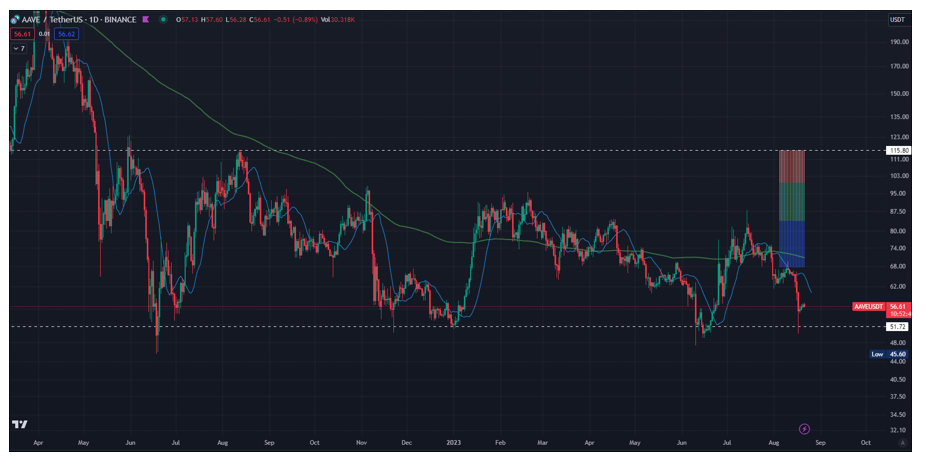
If the price is trading inside any of the red, green or blue areas, that’s a red flag that says, “Do not enter.”
However, if the price is trading in the clear space (like AAVE is in the above screenshot), that’s a green light.
Now, I know that analyzing charts can be overwhelming sometimes. So, the less mental effort you need to understand a chart, the better.
This indicator turns this part of the Sideways Siphon strategy into a simple glance.
Trading inside the colored lines? Stop.
Trading below the colored lines? Go.
How to Get This Indicator
This is not something I planned on sharing, but Martin Weiss asked me if I would bring something very special to the upcoming 2023 Weiss Investment Summit.
Thus, I will be giving everyone who attends my presentation at the summit an exact copy of this indicator to add to their own charts, free of charge to use forever.
You heard that right: There will be no fees and no subscriptions.
All you have to do is attend the summit and come to my presentation. Then, you can walk away with the ability to make your charts look like mine in the screenshot above.
Now, the 2023 Weiss Investment Summit will be held at the historic Boca Raton resort in Florida on Sept. 10–12.
For more information, please call 855-278-9191 (or +1 561-409-8591 for international) to speak with a member of our VIP Executive Accounts Team anytime between 8:30 a.m. and 5:30 p.m. Eastern Monday-Friday.
This is the first time that Weiss Investment Summit tickets have been open to the public as well as members.
There is only room for 350 Weiss Members, so just bear that in mind as tickets are first come, first served.
But that’s all I’ve got for you today. Let me know what you think about this sneak peek into my Sideways Siphon strategy by tweeting @WeissCrypto.
I’ll catch you here next week with another update … and I hope to see you in person at the 2023 Weiss Investment Summit!
But until then, it’s me Chris Coney saying, bye for now.