Ignore the Binance Shock: Bitcoin’s Next Rally May Be Just Days Away

 |
| By Juan Villaverde |
Bitcoin hit an 80-day-cycle top on Sept. 21 when it closed near 87,000.
I’ve been saying ever since that I expect the next 80-day-cycle low to hit the week of Oct. 19.
Then, last Friday, I said that low came just as expected.
But I also gave a note of caution before letting the bullish sign run away from us: It was too early to call the low with confidence.
Price action over the past week confirmed I was right.
All About Timing, Not Price
If you’ve followed my updates for a while, then you know my Crypto Timing Model — and the liquidity indicators I use — all measure the timing of crypto moves.
None of them give us forward looking price predictions.
Which is why I always wait for confirmation before I call a bottom like this. Because the price can hit its bottom … before time runs out on a corrective phase.
That’s what happened in the previous 320-day cycle.
Pricewise, Bitcoin fell to its lowest daily close of the cycle on Feb. 5, 2026. But the timing said crypto winter wouldn’t end until mid-summer.
Sure enough, Bitcoin retested that February low in late June.
We’re now seeing a similar pattern with the current 80-day cycle.
Bitcoin appears to have hit its bottom on Oct. 15 — with an intraday print slightly under $80,000. Then, it gave a stronger indication — a close near that level — on Oct. 17.
That's within days of the Oct. 19 low my liquidity indicators predicted.
And from there, Bitcoin climbed to a high of just $84,000 on Oct. 21.
But then, it began to fall back down to the $80,000-$81,000 level the next day.
And in the past week — even before the Binance hack, which you can read more about here — Bitcoin closed lower than its Oct. 17 level.
That tells me that BTC hasn’t made its low official yet. The good news is that we are still well within the window for that to happen.
What My Forecasting Model Shows
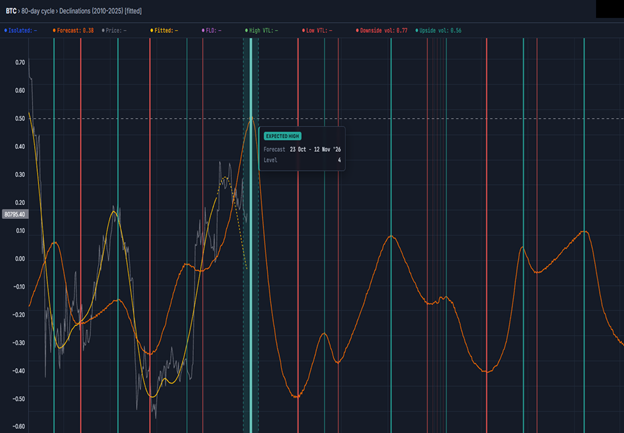
So far this year, the 80-day forecasts on my model have not missed a single date.
The model ranks its predictions from one (least intense) to four (most intense). And it shows that we have a level four forecast for a reversal between Oct. 23 and Nov. 12.
Now, you may notice the model is flagging this date as a top — not a bottom. One of the quirks of this model is it sometimes inverts. That is, it will call a cycle top when we get a cycle bottom instead.
The way to tell if we’re dealing with an inversion is simple: If prices are falling into a forecast date, that date is probably a low. If prices are rising into it, it's probably a high.
TL;DR: Price action into the date is the tiebreaker.
As I write, we’re inside the forecast window, and Bitcoin is falling. So, we're probably getting a low right now.
What about the macro indicators?
Well, liquidity shows Bitcoin bottoming right around now, followed by a rally.
The 10-year Treasury, which leads Bitcoin by about 13 months, shows the same thing.
Both pointed to the week of Oct. 19 for a low, as I've been saying for months.
That's three of my four forward-looking indicators overlapping on the same window. Which means the timing for this pullback should run out soon.
How far will Bitcoin go in that time?
I don’t believe much further. Without the Binance hack, support at the Oct. 15 low looked like it would hold. And even with the hack, Bitcoin is only down about 4.6% on the day.
That tells us there’s not a huge appetite to sell right now.
Still, caution remains key for near-term investors. Which is why there are two levels to keep on your radar …
$76,000 to the downside. This is the next area of established support for Bitcoin. It was already tested in intraday trading. Now we’ll need to see BTC close above it consistently.
$85,000 to the upside. No low can be considered as confirmed until Bitcoin clears $85,000. You’ll know the medium-term trend has shifted once BTC closes above this level.
Of course, this means no one will ring the bell when the low is in. Confirmation comes after.
That’s why I want you to keep these levels in mind. This way, you can follow the market on your own and make the right decisions for your crypto journey.
What Comes Next
As you can see in my forecasting model above, there’s another level four reversal between Dec. 24 and Jan. 13.
My liquidity indicators show the same.
And in between the current low and the one projected by mid-January, my macro indicators — including Treasurys — all show a high on Dec. 2.
Notably, my forecasting model is the only indicator that does not show a high there.
Putting it together, we have a rough outlook for the rest of 2026:
- A low is being established right now. It’ll most likely hit between this week and the end of next week, though it could stretch into mid-November.
- Bitcoin should then rally for about a month into an early December high. I expect this to be a modest rally following the current modest pullback.
- Between late December and early January, all four forward-looking indicators agree we should expect another low. And I said last week I believe this will work out to a 320-day cycle low.
That's the state of crypto this week! A low is imminent, most likely between now and Nov. 12.
A rally into an early December high should follow, then another low in late December or early January.
Which I still say will be the buying opportunity to really watch.
If you want a front-row seat to how I plan to use this opportunity and get timely “buy” and “sell” alerts straight from my model, you may want to watch my latest crypto briefing.
Best,
Juan