Cycles Theory Cuts Through Bearish Bitcoin Noise
 |
| By Juan Villaverde |
I was a cycle analyst long before I got interested in blockchain and cryptocurrency.
The power of deep cycle analysis not confined to crypto. Using it, you can build a model to forecast virtually any financial asset with sufficient historical price data — the longer the record, the better.
However, those years of toil led directly to my Crypto Timing Model. And its remarkable ability to predict what Bitcoin (BTC, “A-”) is going to do with a degree of accuracy that would be impossible otherwise.
To some, that may sound like bold talk. But actually, it’s an understatement. These methods are so powerful they can be used to forecast virtually any time series — tradeable or not.
And yet, after decades of experience with commodities, stocks, bonds and real estate, it never ceases to amaze me how intensely cyclical crypto assets are.
Indeed, it’s a key reason this asset class is my primary focus.
What exactly makes crypto relatively so much “easier” to understand for anyone who embraces cycle theory? The question remains elusive.
Is it because there’s no one with real institutional power to suppress or prop up crypto prices?
That may be part of the answer. And in the past year or so, we have seen instances where institutional activity has shaken up expected market behavior.
But a better explanation is probably crypto’s famous volatility. Which can make you rich or wipe you out — with very little margin in between!
Fear and greed run completely unchecked in crypto, unanchored and unfiltered.
Volatility amplifies both price action and the sentiment surrounding it. Prices don't just turn; narratives ricochet wildly alongside them.
You don't see that in stocks. Or gold. Or bonds. And this makes certain cycles — like Bitcoin's 80-day cycle — almost impossible to miss.
And what never fails to amaze me is how wildly the narrative can swing as a cycle reaches its final stages. And how when it swings is the moment to watch for.
Understand the Sentiment Shift
In early May, with Bitcoin poking above $80,000 for the first time in months, conventional crypto bulls came out of the woodwork to declare the bear market dead.
So, even though Bitcoin had been climbing for a few weeks into that level, as we tracked, sentiment shifted almost overnight … right near the peak.
We were no longer in the end times of crypto. But enjoying the warm-up before new all-time highs.
And just like that, this mood swing marked the last 80-day cycle high.
One thing I've observed over the decades is: Sentiment doesn’t shift when a cycle peaks or bottoms. It happens after.
Few notice the change in trend. It's subtle. No one rings a bell at the top.
And sentiment lags price action.
In fact, it tends to hit extremes right around the time of the turn. Massive euphoria and optimism typically appear on the day of the top. And in the days and weeks that follow.
Even after the peak, most people treat the initial dip as a buying opportunity.
Bottoms are a mirror image. No one much cares when the cycle turns down and prices begin to fall.
Eventually, however, a big down-move arrives. Usually LONG after the market has peaked. It’s only when and the decline enters its final stages that the fear sets in.
New narratives — which were not present at the actual top — get attached to the sell-off. Bitcoin’s current decline illustrates this perfectly.
The day of the top? Sunday, May 10, on a daily closing basis. Bitcoin began its decline (from $83,000 to near $67,000 presently) the very next day, on May 11.
Between May 11 and May 31, Bitcoin declined steadily with very few pauses. Nobody batted an eyelash. No narrative to explain it; it was broadly dismissed as a buy-the-dip moment.
Then, this week arrived. Suddenly, the market could no longer ignore that the Strait of Hormuz situation is FAR from resolved.
Oil rallied, as Bitcoin Fell Sharply Alongside
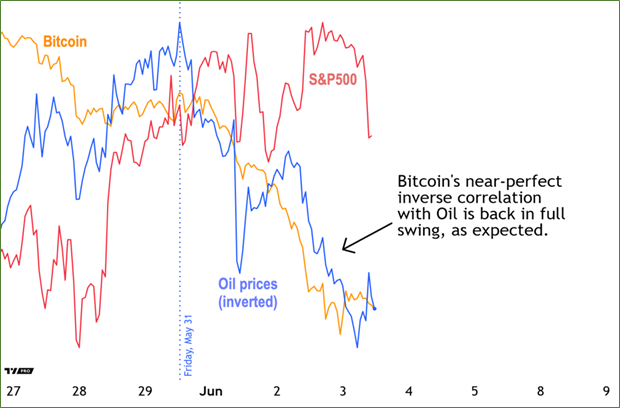
As you can see, the stock market continues to ignore reality, setting record high after record high. (A word of warning to stock investors: When this situation reverses, you will likely not have enough time to exit at these prices.)
Meanwhile, Bitcoin and inverted oil are both moving in the same direction on this chart. That means oil is surging — and dragging Bitcoin lower with it.
Why is Bitcoin the only risk asset that seems to care about what's happening in the real economy?
That's a tough question. Which we may only be able to answer in hindsight, if at all.
However, this result was partly anticipated by my Forecasting Model, which predicted a Bitcoin decline running alongside an oil rally.
To be fair, I would have expected the oil rally to be more dramatic. But there’s still time for that; so, don't rule it out.
What’s Really Happening with Bitcoin
Now, over the past few days, as prices have pushed even lower, a new narrative has emerged to explain the sell-off: Michael Saylor's Strategy (MSTR) sold 32 BTC.
That alone isn't enough to move any market. And it’s barely a single percent of MSTR’s massive 500,000 BTC balance.
But it was enough to spook investors because Saylor is famously Bitcoin's largest known holder. The fear is that if he decides to liquidate, a mad dash to the bottom could swiftly ensue.
Spoiler alert: That’s highly unlikely.
Strategy disclosed the sale was made not because of BTC weakness, but because the company needed liquidity this month fund preferred dividend payments.
Additionally, I saw Michael Saylor speak last month at Consensus Miami. And that did not sound like a man looking to get out of crypto.
Which brings me to my original point. We need to understand these narratives for what they are: Post-hoc explanations for why prices turned down.
It's the cycle talking, and the headlines interpreting after the fact. Nothing more, nothing less.
When people finally start noticing a sell-off that after it’s been underway for nearly a month, it's usually right near the end. The descent has largely exhausted itself, and prices are on the fast track to finding a bottom.
Just in time to hit the first low signaled by my liquidity indicators.
You’ll recall, my liquidity indicators suggest a low later this month. And my Crypto Timing Model suggests a 320-day-cycle low by late July.
How do I reconcile the difference? A double bottom.
That is, I believe price- ise, we’ll hit our low by the end of June. And I strongly suspect that’ll be near the February low of $60,000. Then, we’ll see range-bound trading off that level until July.
That’s not to say BTC can’t break below $60,000. But I don’t see that as very likely.
It also doesn’t mean we’ll see a rally immediately on the other side of the low. Instead, it’ll be a window both investors and traders should target to gain exposure.
Bottom Line
Study cycles long enough, and the narratives attached to it become a powerful contrarian indicator.
Optimism signals a top. Pessimism signals a bottom.
We're in the latter right now, at least when it comes to crypto. Which means my initial analysis is proving correct. And soon, we’ll see the best time to load up on our favorite cryptos for the rest of the year.
To see exactly when my Crypto Timing Model suggests you do just that, click here.
Best,
Juan Villaverde
