The Best Time to Buy Bitcoin Is on the Horizon
 |
| By Juan Villaverde |
The two most accurate liquidity indicators I track — Central Bank Liquidity and Japan’s M2 money supply— began to diverge around March 10.
I was a bit hesitant to draw attention to this divergence. After all, there was no way to know for sure which indicator Bitcoin would track.
But the past month’s worth of trading action has brought a great deal of clarity.
And the next few trading days are set to bring even more.
Let me explain …
Last month, Japan M2 began a corrective move into early April. While CBL showed a near-uninterrupted rally between February and late April.
Here is the chart I showed you back then.
When Liquidity Forecasts Diverge
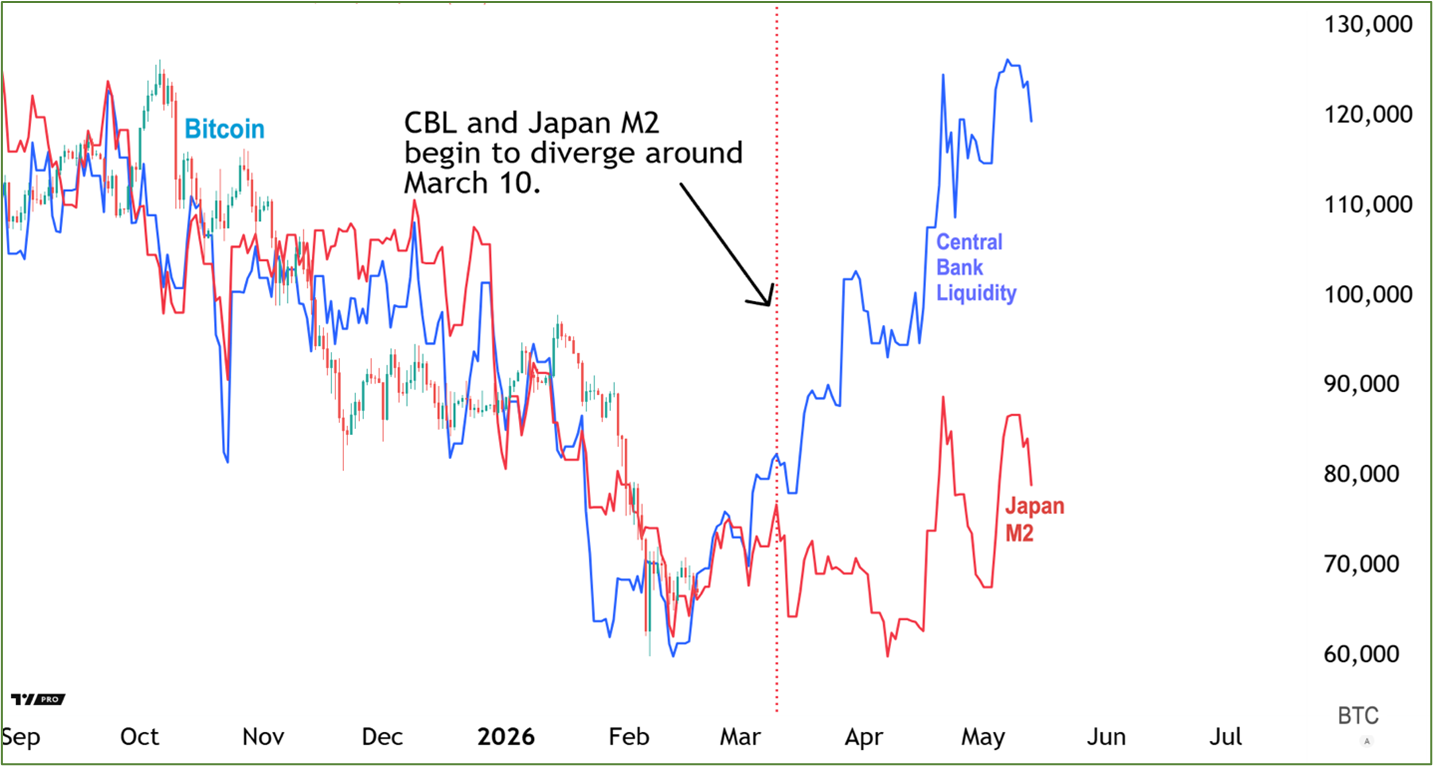
My commentary at the time:
CBL points to a powerful rally beginning soon. One that continues largely uninterrupted until Bitcoin closes in on $100,000 in late April or early May.
JPN M2, however, paints a more muted picture.
It anticipates Bitcoin will struggle within a range. There is a chance it may be unable to break meaningfully above $75,000 by mid-March.
To recap, CBL anticipates strength. JPN M2 points to stabilization and grind. But neither suggests an ongoing crash.
Fast forward to early April, and the picture has clarified considerably.
Here is the updated chart, showing Bitcoin alongside both liquidity metrics:
Bitcoin Chooses Japan M2
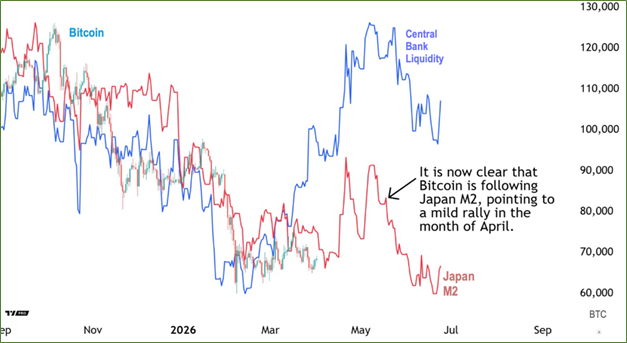
What was too soon to conclude back in March has now become unmistakable. BTC is tracking Japan M2 — which anticipates a low on Apr. 7.
And this broadly aligns with my geocosmic-based forecasting model — which projects a low around Apr. 5.
To be clear, this is unlikely to be a major low. But it’s the most significant one forecast so far in 2026.
What makes this April 5—7 low particularly interesting is that it falls squarely within the window of President Trump's ultimatum deadline for Iran to come to the table with some kind of deal.
If a deal materializes, markets will likely rally sharply and quickly.
Note how the red liquidity line jumps dramatically in the lead-up to the April 20 top posited by my forecasting model. And the April 21 top forecast by Japan M2 in a near-perfect agreement.
Meanwhile, global markets continue to trade in tight correlation with world prices.
So, we can reasonably speculate that any deal that gets made with Iran would be short-lived.
That would explain the rally being followed by a prolonged correction.
Japan M2 currently shows a decline stretching into late June or early July. My forecasting model offers some additional clarity: Aug. 13 appears to be the most significant low of the year, followed by another critical low on Oct. 15.
One more thing. Suppose Bitcoin does indeed manage a meaningful rally as early as next week, followed by a top later this month. Expect the ensuing correction to carry into the second half of 2026 — likely around August.
That would represent the third and final phase of crypto winter. With what I believe will be the best buying opportunity in years waiting on the other side.
If you want to know the exact moment my Crypto Timing Model says to jump in, I encourage you to watch my recent briefing here.
Best,
Juan Villaverde
