The Weakest Bear Market in Crypto History Is Over

 |
| By Juan Villaverde |
Never doubt the difference just a week can make in the crypto market.
After over a week of hugging, kissing and all but getting down on a knee and proposing to the green downtrend line, Bitcoin (BTC, “B+”) finally marshaled the oomph to push firmly above this key indicator.
I first told you about it at the end of July. At the time, I explained how significant this would be.
Now, it’s confirmed for my Crypto Timing Model that Bitcoin established its 4-year-cycle low between June 25 and July 1.
A double bottom, slightly under $60,000 — as I suspected all along
That double bottom was, in turn, a retest of the Feb. 5 crash low. Which I repeatedly warned was likely to be revisited, possibly slightly exceeded, sometime near mid-year.
That's the main takeaway this week. Everything else is downstream of this one critical fact.
And here's the kicker: Now that the bottom is in, we can confirm that this was the weakest bear market in crypto history.
Bitcoin fell "only" about 50% from its all-time high near $125,000.
In prior bear markets, crossing this downtrend has only occurred after BTC plummeted roughly 80% from its top.
But as I've said many times: This bear market is different.
Mostly because institutional capital is now deeply embedded in crypto. These are disciplined professionals who trade countercyclically. In a way that dampens the volatility crypto has historically been famous for.
That doesn't mean the asset broke. It simply matured.
And now, here we are, with my Crypto Timing Model confirming a 4-year cycle low after the …`
Weakest Bear Market Drawdown in Crypto History
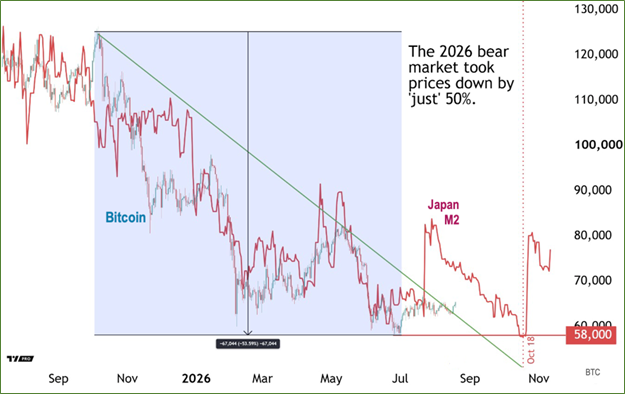
I included this chart to illustrate two things …
First, Bitcoin is down roughly 53% from the bull market high to the suspected low in late June. That’s the weakest drawdown on record.
Second, this clearly tells us what comes next: a multi-month selloff.
That’s not news. I’ve been warning you of a correction between August and October for weeks now.
Here’s what did change …
Because prices have crossed the green downtrend line, and positively surged shortly thereafter, we can say with confidence that the June 25/July 1 double bottom will likely hold as support when it’s retested around mid-October.
That gives us confidence in where the floor will be. And gives investors the green light to start looking for the chance to load up.
(In fact, my Crypto Timing Model just flashed its first buy signal of this new cycle for my long-term investors. To learn more about it, click here.)
And after some further consolidation, the next explosive bullish cycle awaits later this fall.
Barring, of course, any genuinely negative catalyst.
Best,
Juan Villaverde