
 |
| By Juan Villaverde |
As a cycles analyst, I know the underlying rhythm of the markets trumps any single macro liquidity indicator.
Every movement in every market — including liquidity indicators themselves — is governed by its own primal heartbeat.
To refine my understanding of that heartbeat, I rely on macro indicators. Because there is a lot of noise and nuance when it comes to analyzing cycles.
This is important to understand. Because as we write, my Crypto Timing Model indicates that the $58,000 level — which marks the double bottom we saw between June and July — is also likely the 4-year-cycle low.
We are still waiting for final confirmation, which I expect by early August.
Here’s the key takeaway: When cycles align like this, it means we should see less resistance as Bitcoin (BTC, “B+”) pushes higher.
But there’s a catch. Just because the road has been cleared, doesn’t mean we have the fuel to make this racecar run.
See, all crypto bull runs are preceded by strong up-moves in global liquidity benchmarks roughly three months before crypto itself makes its move.
So yes, cycles come first. And that they point to a 4-year-cycle low for Bitcoin sometime this year, as I pointed out on Friday.
That almost guarantees Bitcoin climbing higher heading into 2027.
BUT without a meaningful pickup in global liquidity — whether measured by the Japanese M2 money supply (JpM2) or the broader Central Bank Liquidity (CBL) — there can be no renewed crypto bull run yet. Just an end to the selling.
And that's the issue we face today: We don't yet have a solid low in either CBL or JpM2 — my two best liquidity indicators.
So, since these indicators are so central to understanding when the next big run will come, I think it’s time we take a closer look at them …
Liquidity’s Dual Components
What macro analysts call "liquidity" is really driven by two factors:
- First, there’s the natural rise and fall of monetary aggregates such as central bank balance sheets, CBL, JpM2.
- Second, there’s the price of the dollar versus that country’s currency. Which is actually the dominant factor.
So, when I say "Japanese M2," I really mean the amount of money available in Japan, expressed in U.S. dollar terms.
This may seem obvious, but the distinction is crucial.
Why? Because whether we look at CBL, JpM2 or any other liquidity metric, that figure is dominated by the U.S. dollar exchange rate.
Let me give you a visual.
Japanese M2 Money Supply, in Yen
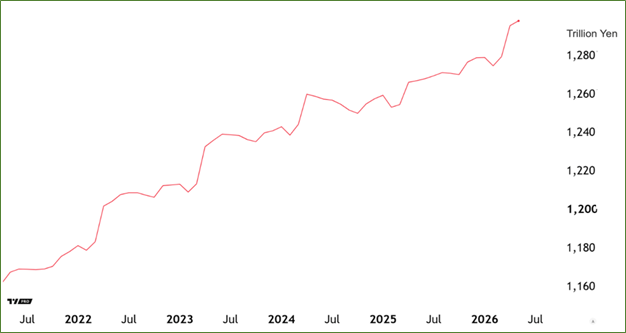
As you can see, it’s a line that just climbs steadily to the top right. In a fiat money world, the broad money supply of most major economies behaves this way.
If this were a leading indicator for Bitcoin, it would be in a never-ending bull run. Which we know isn’t the case.
That tells us we need to put this data into context by expressing it in terms of U.S. dollars (below). Notice the dramatic 2022 fall in USD-denominated JpM2. And for the rest of the period the red line mostly moves sideways.
Japanese M2 Money Supply, in U.S. Dollars
And as JpM2 moved sideways between 2023 and 2025, there were multi-month rallies followed by multi-month declines.
Every time, roughly three months after JpM2 (represented in USD) rallied, Bitcoin rallied too. And when JpM2 declined, Bitcoin followed suit about three months later.
That's the power of global liquidity.
Below is another version of basically the same chart. But I’ve added the price of the yen as shown in USD.
Remember, this is the second component in understanding JpM2 as a liquidity indicator. And you can see that JpM2 is almost indistinguishable from the JPY/USD exchange rate.
JpM2 Moves Mirror Dollar/Yen Exchange Rate
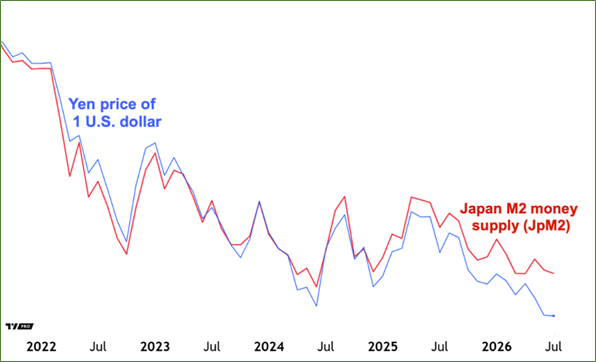
In other words, to know when Bitcoin will rally, we need to look for the moment the Japanese yen begins to rally strongly against the U.S. dollar.
Since currencies tend to move together, we can generalize using the U.S. Dollar Index (DXY). And say: Bitcoin is likely to make its next major move up the moment the dollar begins to weaken broadly.
My forecasting model can also predict the cycles for the yen and DXY. So, I decided to take a look to see when both were likely to reverse course.
And indeed, my model identified June 3 as a likely top for the DXY. And June 17 as a high for the yen against the dollar.
Both are expressions of dollar weakness. And Bitcoin tends to follow dollar weakness with a three-month lag. So, this points to a possible low around September/October.
I’ll be fully transparent and the first to note that these models have a margin of error. And on multi-month cycles, it can be plus or minus several months.
Still, this is still good news. Because we want to see the dollar weaken — both against a broad basket of currencies (DXY) and against the yen specifically.
In other words, we want tops in both.
And once those tops are confirmed, Bitcoin is very likely to make its final low roughly three months later. Then, it’ll be able to launch the new bull market for real.
One final note: As I mentioned on Friday, both JpM2 and Central Bank Liquidity highlight the same window for the next low: September/October.
There are no guarantees in crypto. But when multiple powerful indicators align, we should pay close attention.
Bottom Line
So yes, the crypto cycles come first in my analysis.
And that they point to a 4-year cycle low for Bitcoin sometime this year. Indeed, confirmation of just that could come very soon. And it almost guarantees Bitcoin climbs higher heading into 2027.
BUT without a meaningful pickup in global liquidity — whether measured by the JpM2 or the broader CBL — there can be no renewed crypto bull run yet.
Just an end to the selling.
Fortunately, both the liquidity indicators themselves and the strength of the dollar in comparison to JpM2 point to the same window of opportunity ahead.
Savvy investors know that the quiet, sideways market in between now and then doesn’t mean there’s nothing to do.
Quite the opposite.
Crypto whales who have a long investment horizon have already begun to load up on BTC. And as we move into the fall, your watchlist altcoins will likely present appealing entry opportunities.
That means you’ll need to keep your thumb on the market to catch them over the coming weeks.
Best,
Juan Villaverde
P.S. While you wait to load up on your favorite cryptos, there’s a strategy that could help you increase the capital you have to deploy when the time comes.
It’s called the Friday Income Machine. And it’s been proven to produce consistent, weekly payout opportunities of up to $1,000 — and potentially more — nearly every Friday morning since 2020.