This Can Tell You When Bitcoin’s Real Rally Will Start
 |
| By Bruce Ng |
No one can know for certain when Bitcoin (BTC, “A”) will finally begin its next bull market rally.
But my colleague Juan Villaverde’s proprietary Crypto Timing Model has successfully indicated key cycle lows and highs through several bull/bear cycles. That includes the 2023 long-term low that kicked off this current bull market!
If you are a member of any of our crypto publications, you get timely recommendations based on what the Crypto Timing Model is telling us. And if you’re one of our Wealth Partners for Life, you get direct access to the model’s output.
If you’re doing this on your own or you’d like yet another resource, there’s another indicator you should know about. Because you can track this one on your own.
It was spot on back in April when Bitcoin started to correct. And I believe it will strike true again to tell us when we can expect BTC to start rallying for real.
It’s called a spot cumulative volume delta, or CVD.
That’s a mouthful of technical jargon in such a small acronym. So let me break it down for you …
- Spot means we are dealing with only spot — or real-time — trading volume.
- Delta refers to the buy volume minus sell volume for a particular candle period. Candle period refers to Japanese candlestick charts. It’s just the length of time selected for a particular chart. For example, one hour, one day, etc.
- Cumulative means the delta for each successive candle is added from left to right, starting at zero for the leftmost candle of the chart. This means the CVD depends on where you start viewing the chart from the left.
We could dedicate articles to each metric.
But we like to keep things simple so that you can start seeing them in action right away.
So, said simply, a spot CVD is a measure of how much stronger buying pressure is over selling pressure over a period of time for a particular asset.
- If a spot CVD is going down, sell pressure is stronger on that asset.
- If a spot CVD is going up, then buy pressure is stronger.
And if it is moving sideways, that means the asset is in a distribution or reclamation phase.
So, now that you understand the basics of how to read a spot CVD, let’s look at it in action for Bitcoin below:
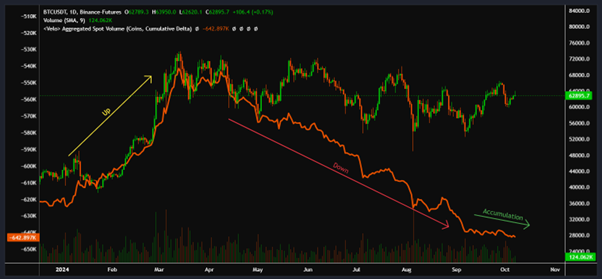
Above is the price action for Bitcoin for 2024, with each candle — vertical red or green lines — marking a single day.
Pay attention to the solid orange line weaving its way through the daily candles. That’s the CVD. You’ll notice that there are three distinct phases in the chart above:
- Up: During the BTC rally from February to the end of April, the spot CVD was climbing up. Remember, that means the buy pressure was on the rise, as well. Then, BTC hit its all-time high of $73,000 in March.
- Down: Around April 11, the spot CVD started to slope downward. This corresponded to the choppy, gradual downward price action that lasted all the way through to the start of September.
- Accumulation: Something qualitatively changed in early September. The brakes were hit on spot CVD selling, which caused the slope to tilt sideways. This accumulation phase also lines up with the Sept. 13 interest rate cut announcement.
Since the end of April, we have gotten many mini rallies and choppy price action. And each one caused the talking heads to hail the return of the bull rally.
But no such rally occurred.
Looking closer, you can see that the spot CVD trend was going lower the entire time.
So none of these wicks higher ever had any legs underneath them.
This is why the current accumulation phase is so important. While there isn’t a clear push for buyers, this suggests that selling pressure has finally bottomed.
In other words … we’re close to seeing the selling pressure end and the buying pressure begin again.
What we need to see next is that the spot CVD line begins to creep upward. When that happens, it’s time to back up the truck to load up on Bitcoin and altcoins.
So, keep a sharp eye on the spot CVD for your favorite cryptos over the coming weeks. It may just reveal a shift in sentiment you’ll want to get ahead of.
Best,
Dr. Bruce Ng