 |
| By Grant Wasylik |
Each week, I compile some meaningful numbers that allude to what the markets and economy are doing. This week, I want to share those with you. If you enjoy them, click here and let me know so we can continue to do so going forward.
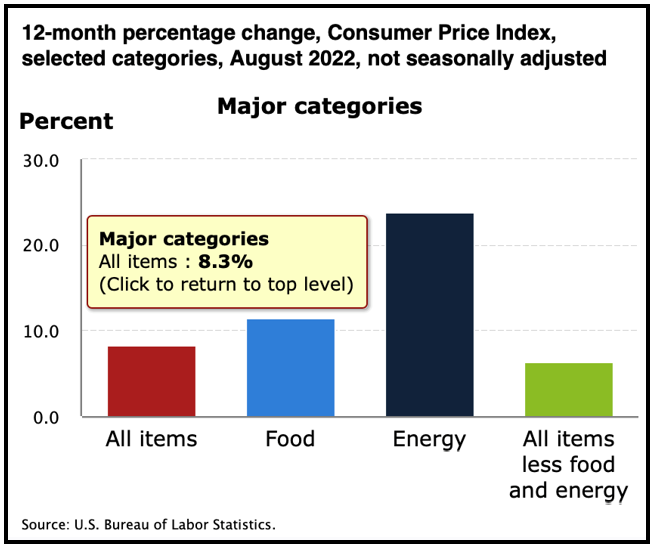
Destination: The Consumer Price Index, which currently stands at 8.3%, is unlikely to drop to 4%–5% anytime soon. The federal funds rate and U.S. yields could be heading to 4%–5% in the next 4–5 months. New highs in yields could equal new lows in stocks.
Click here to see full-sized image.
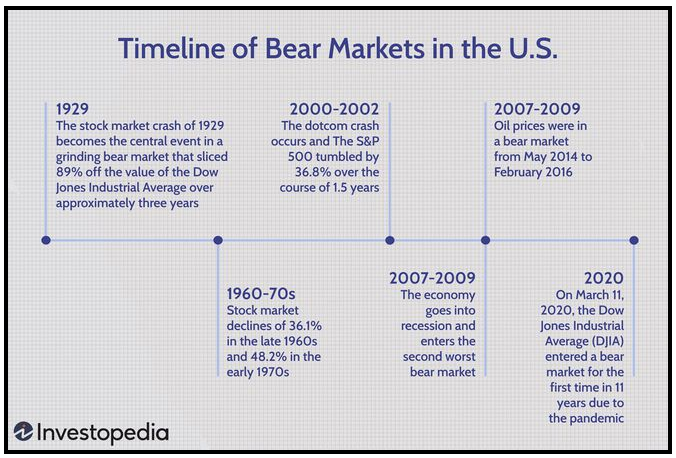
Tale of the Tape: The S&P 500 is in its 20th bear market in the past 140 years. Average peak-to-trough decline during those 20 bear markets is 37.3%, and the average duration is 289 days. History is no certain guide to the future, but it suggests this bear market could end Oct. 19, which just so happens to be the 35th anniversary of Black Monday.
Click here to see full-sized image.
Recession Mentions: Of the 500 companies in the S&P, 240 cited the term “recession” in Q2 earnings calls, surpassing the previous high-water mark of 212 from the beginning of the pandemic in Q1 2020.
Inflation Mentions: Of the 500 companies in the S&P, 412 cited “inflation” in their Q2 earnings call. Those companies are feeling the impacts — you don’t have to. If you’re interested in the Weiss strategy that’s combatting inflation and holds up in bull or bear markets, click here to learn more.
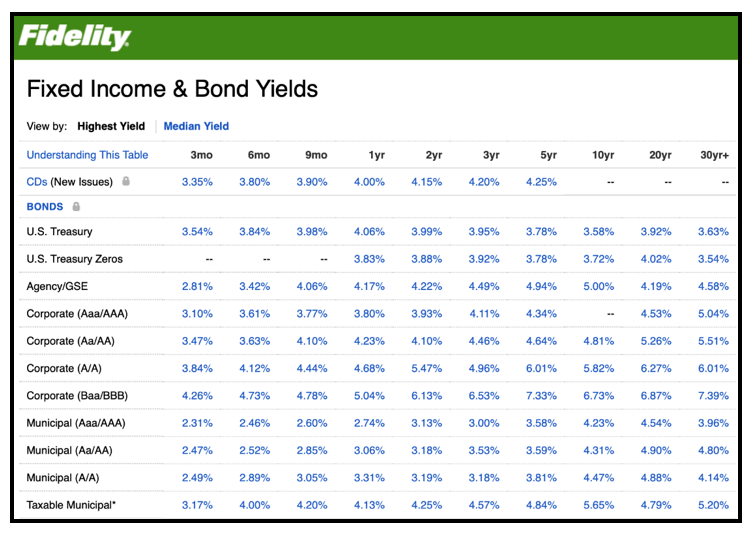
One-Year Treasury Yield: The one-year U.S. Treasury note yield hit 4% on Sept. 15, its highest level since October 2007. Only 15 months ago it was at an all-time low of 0.04%.
Click here to see full-sized image.
Muni Dump: This year’s tally of outflows from municipal bond funds and exchange-traded funds hit $84 billion, on track for the largest annual net redemption since at least 1992. Such a cash exodus is a hallmark of poor performance for the muni market, which is dominated by individual investors. Munis are on track for their worst year since 1981.
Record Wealth Drop: U.S. household wealth fell by a record $6.1 trillion in Q2 to its lowest in a year, as a bear market in stocks far outweighed further gains in real estate values.
Millionaires on the Move: Traditional strongholds of wealth, such as New York and Los Angeles, are losing a segment of their high-net-worth individuals to other cities across the country and abroad. These are the top-10 cities gaining the most millionaires: (1) Austin, TX, 14%, (2) Houston, TX, 6%, (3) West Palm Beach, FL, 6%, (4) Miami, FL, 5%, (5) Greenwich, CT, 5%, (6) San Francisco, CA, 4%, (7) Phoenix/Scottsdale, AZ, 4%, (8) Dallas/Fort Worth, TX, 3%, (9) Seattle, WA, 2% and (10) Washington, DC, 1%.
King’s Inheritance: King Charles III has inherited the majority of a portfolio of assets worth around $28 billion in value. Due to a 1993 agreement with the British government, all of that is exempt from inheritance tax. For the rest of the U.K., inheritance tax is 40% for estates worth more than $377,000.
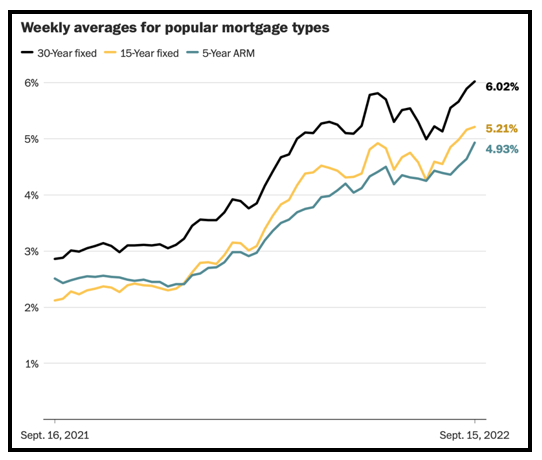
Mortgage Rates Surge: The average interest rate for 30-year mortgages is above 6% for the first time since 2008 — more than double one year ago.
Click here to see full-sized image.
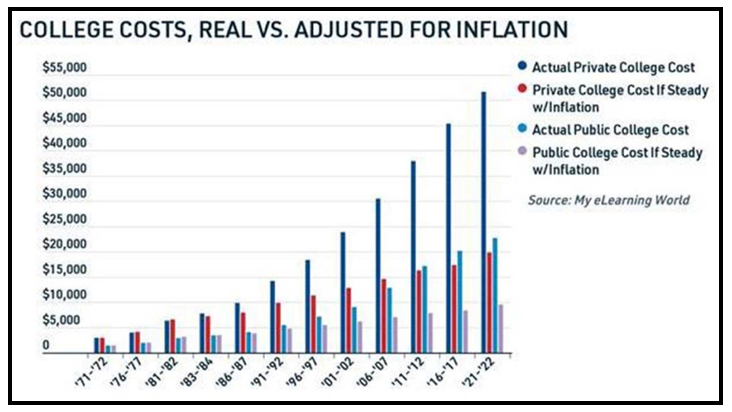
College Costs: U.S. News & World Report released its yearly ranking of the best colleges in the country on Sept. 19, and 19 of the top 20 schools on this year’s list cost $55,000+ per year to attend.
Collectibles Craze: A jersey worn by basketball legend Michael Jordan in the first game of the 1998 NBA Finals sold for $10.1 million, breaking the record for game-worn sports memorabilia. Sotheby’s expected up to a $5 million winning bid, but 20 offers drove the price to double that estimate.

Click here to see full-sized image.
Remember, if you enjoyed this week’s “By the Numbers,” click here and let me know so we can continue sending you content like this.
Best,
Grant Wasylik