 |
| By Nilus Mattive |
Last week we (finally) got the September Consumer Price Index (CPI) inflation data.
And based on the ongoing government shutdown …
Which is apparently preventing Bureau of Labor Statistics (BLS) employees from going out into the field to manually collect prices of different things …
It sounds like we will not get October CPI data at all.
You know what I say? Who cares!
It’s all manipulated anyway.
I have written about the mathematical tricks plenty of times before:
- The substitution games …
- The “owner’s equivalent rent” rather than actual home prices …
- As well as all the different measures from so-called “core” to “chained” to “all items.”
Suffice it to say, the CPI has never given us a truly accurate, consistent measure of our daily experiences.
Especially since those experiences greatly depend on what exactly we spend our personal budgets on.
However, what I’ve also noticed is that the CPI data gets manipulated in yet another critical way.
That is, through the language analysts, pundits and reporters use when they talk to us.
For example, the headline September CPI data showed prices increasing at 3% on a year-over-year basis.
This is a full 50% higher than the Federal Reserve’s inflation target.
That’s bad, m’kay?
Yet, plenty of reporters choose to talk about the fact that 3% annual inflation was “better” than the 3.1% economists expected.
Herein we find the first way a fact gets manipulated …
Someone creates some arbitrary target that’s even worse. And they use it to make us all feel better.
Does “at least inflation didn’t come in at 3.1%” make you feel better? Me, either!
Meanwhile, here’s a quote from BlackRock’s chief investment and portfolio strategist, Gargi Chaudhuri:
"Today's CPI report confirms inflation's slow, but steady, descent.
“Goods prices are firming again amid tariff pressures, but softer shelter and services readings show progress where it matters most.
“The disinflation trend is intact, keeping the Fed on course for a rate cut next week."
You will hear similar things from plenty of Wall Street’s easy money addicts.
In fact, Wall Street successfully used the September release to manipulate the Dow above 47,000 for the first time Friday.
This idea of “disinflation” is an even more malicious way they try to manipulate reality.
It supposedly means that inflation is happening more slowly than it was at some other time.
But that’s meaningless to all of us.
Because inflation is STILL happening, and STILL at a faster rate than even our own monetary policymakers want!
Moreover, even declaring such a disinflation trend depends on what period you use for your measurement.
Here’s the full 20-year chart of CPI data directly from the BLS website …
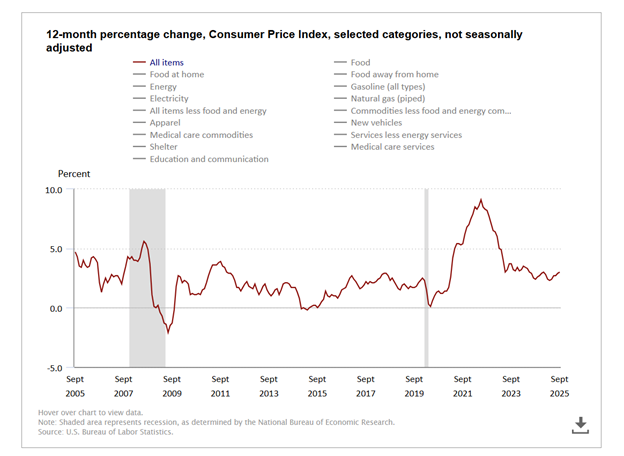
Yes, a 3% annualized inflation rate is much better than the 9.1% annualized rate we saw back in June 2022.
But as you can also see, it is also higher than the steadily climbing rates reported in April, May, June, July and August!
Let me repeat that: Inflation has been ticking up consistently for the last six months.
Does that sound like disinflation to you?
Here’s what really matters — not plotting the CPI changes but plotting the cumulative effect of those CPI changes.
In other words, how much less each dollar buys over time.
Here’s the ten-year chart directly from the Federal Reserve of St. Louis …
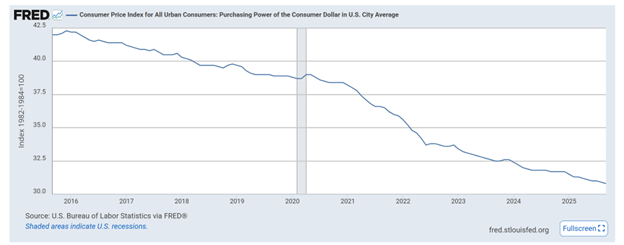
As you can see, it’s a relentless … uninterrupted … devaluation of your hard-earned savings.
We don’t need government employees to go to the grocery story to confirm any of this … we go there ourselves all the time.
So, you need to fight fire with fire.
You need more income than your growing expenses.
That’s why on Tuesday, I’ll be sharing a proprietary strategy to do just that.
It kicks off at 2 p.m. Eastern. So, grab your spot here.
Best wishes,
Nilus Mattive