 |
| By Karen Riccio |
Smart investors know that they never have enough tools in their kit to increase their profits.
I wrote about one such tool not too long ago: moving averages. You can use them to gauge a stock’s strength or weakness and identify points of support and resistance.
Today, I want to talk about another tool in a smart investor’s kit …
The Relative Strength Index, or RSI, is a widely used momentum indicator that measures the speed and change of price movements. Developed in 1978 by J. Welles Wilder, the RSI moves between 0 and 100 and provides valuable insights into the strength and direction of a stock's price movement, helping you make informed decisions.
An indispensable benefit of the RSI is that it can reveal overbought or oversold conditions. An RSI reading below 30 is considered oversold, and a reading above 70 is considered overbought.
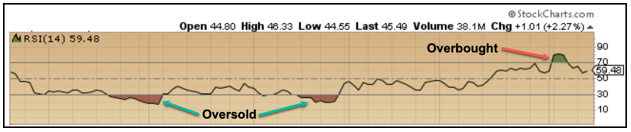
RSI values of 30 or less indicate that a security is undervalued/oversold with respect to its price behavior. That doesn’t necessarily make it an immediate “buy,” however.
When the oscillator goes from below 30 to above 30, that’s your “buy” signal. Just because a stock becomes apparently “oversold” doesn’t mean it can’t stay that way for a long, long time. After all, “markets can remain irrational longer than you can remain solvent,” as the famous John Maynard Keynes quote goes.
This is why a move back above 30 is important. It signals momentum returning to the stock.
The flip side, as you’d expect, signals the opposite.
Typically, RSI values of 70 or more indicate that a security is in overvalued/overbought territory and might be primed for a corrective pullback. When it moves from above to below 70, it’s considered an exit, or “sell” signal.
RSI Divergences Are the Real Key
Although using the RSI to identify overbought and oversold signals is certainly useful, it's important to remember that markets and stock prices move around.
The RSI is just a calculation, an indicator. It’s based on what’s going on in the market, or with a stock or ETF. But when it doesn’t follow the market, it’s important to look at and trust other indicators and signals, as well. That’s when looking at RSI “divergences” becomes most reliable in spotting trend reversals.
A divergence occurs when a stock’s price moves in one direction while the RSI moves in the opposite direction. Again, there are two types.
A bullish divergence occurs when a stock makes lower lows, but RSI makes higher lows. This is a signal that downward momentum is slowing, and a bullish reversal may follow.
After identifying a bullish divergence occurring when the RSI is below 30, an investor would typically look for the RSI to cross back above 30. The cross above 30 is the entry signal.
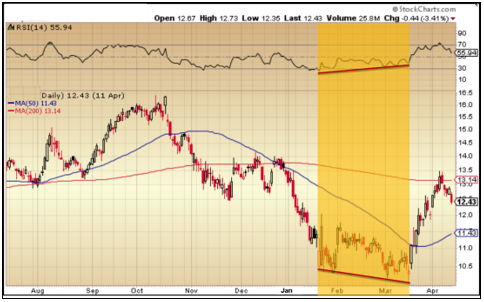
In this chart, you can see the RSI is trending higher, while the stock is trending lower. This indicates that the sell-off is running out of steam and is primed for a bullish reversal.
Conversely, a bearish divergence occurs when a stock shows higher highs, but the RSI shows lower highs.
This is a sign that upward momentum is slowing, and a bearish reversal may occur. After spotting a bearish divergence, an investor might use a cross back below 70 as an exit signal.
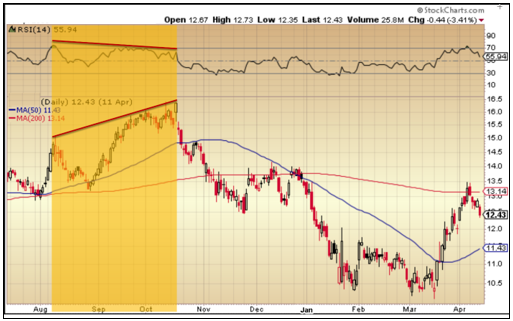
You can see in this chart, the RSI started dropping, but the stock kept pushing higher. The RSI here indicates the stock’s rally is running out of steam. In this case, the indication was correct … the stock was peaking in price.
Using the RSI to spot divergences and recognize potential oversold or overbought conditions can help you find potential trading signals. But it’s not foolproof.
It's important to recognize that technical indicators are tools to help you make better, more informed decisions.
It’s also important to remember that although it is a strong indicator, the RSI is just a calculation that doesn’t react to other factors that affect a stock’s movement. Factors like economic news, earnings or other fundamental aspects are important to factor in when using the RSI.
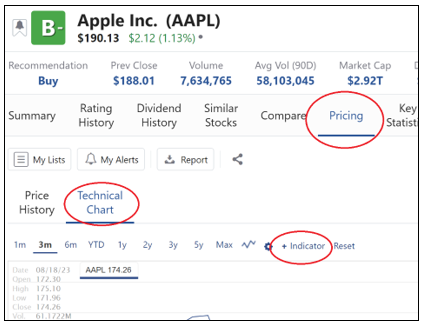
The RSI doesn’t always work alone. It’s often beneficial to use the indicator with other forms of confirmation — like the Weiss Stock Ratings. In fact, you can also find a stock’s RSI by using our screener.
After plugging in the stock name, go to “Pricing” and click on “Technical Chart.” Once there, click on the plus sign next to “Indicators.” Scroll down and you’ll find the RSI.
There you go. Now you can add the RSI to your investment arsenal. It never hurts to be fully prepared with all the information available before putting your investments into play.
Have a great weekend!
Until next time,
Karen
P.S. RSI is a great tool … when judging whether momentum is turning around. But what if you already know that? Fortunately, on Tuesday, we can show you how to play a very clear bull market that’s already happening. Check out this exclusive presentation by signing up here.