The 4 Big Forces That Will Shape 2024 and Beyond
 |
| By Nilus Mattive |
With the first month of the new year almost over, there are four major forces I’m looking at to form our big-picture market outlook.
In no particular order, let’s first look at …
Market Force No. 1: Interest Rates
It’s no secret that monetary policy has been driving the markets over the last two decades — namely, the Federal Reserve keeping its interest rate target pegged to zero … but also other experimental money printing measures and government stimulus programs.
In short, we’ve been living with ultra-easy money for more than two decades straight now.
And that has compelled investors to take on more and more risk in search of returns …
It has caused most assets to soar in value …
And it largely created the big spike in inflation we’ve been seeing, as well.
Now, the Fed quickly reversed course through a very aggressive series of rate hikes, which hammered bonds but left the stock market mostly unscathed.
Weird, right?
Well, there are two important things to note …
First, when viewed through a larger historical lens, interest rates aren’t really high.
If we only go back over the last 20 years, interest rates are pretty high right now.
But if we go back and look at the last seven decades?
See for yourself:
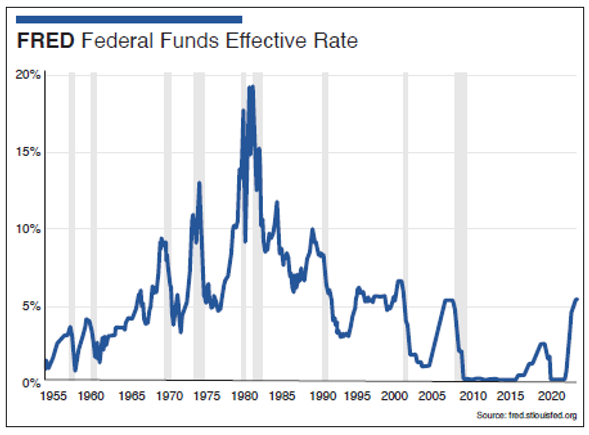
Prior to the year 2000, rates were typically in the 5% range. Rarely did they go much lower between 1970 and 2000. In fact, there were even times when they were two or three times higher!
Even including the last 20 years of artificially low interest rates, the Fed funds rate has averaged roughly 4.6% since 1954.
That means the current target range of 5.25% to 5.5% is really just slightly above “normal.”
Second, the stock market tends to drop sharply once the Fed begins CUTTING rates.
I believe most stock investors have already started looking past today’s rates in anticipation of the next big Fed pivot — a return to rate cuts.
And make no mistake: I think we WILL see that happen sooner than later.
The problem is that rate cuts have historically been bad for the stock market, at least initially.
According to research from Morgan Stanley (MS), there have been nine different interest rate cycles over the last 50 years, and the stock market fell after the first rate cut during seven of them. The average decline was 23%.
That leads me to the second big force …
Market Force No. 2: Valuations
If you want more proof that the stock market is ready for a big collapse, you need only look at where it is right now relative to the last 50+ years.
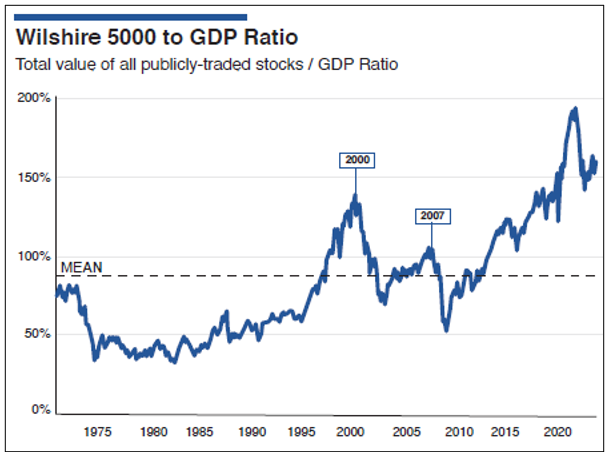
My favorite valuation metric for stocks is the so-called “Buffett Indicator,” which takes the total value of a country’s publicly traded stocks and divides it by that same country’s annual gross domestic product.
A level around 80 has been considered fairly normal for the U.S. And whenever the ratio has gone well above 100, a sharp correction has ensued.
Yet the indicator went as high as it has ever been back in 2020 and remains well above levels that precipitated the last two major market meltdowns …
A lot of people have come up with explanations for this perpetual state of overvaluation — citing things like companies generating more money from foreign countries, lower corporate tax rates, the proliferation of higher-profit-margin tech companies and most recently, the promise of artificial intelligence.
As I explained a moment ago, I think there’s a much simpler reason: Massive government money printing.
In fact, if you look at a chart of the Federal Reserve’s balance sheet — which is a very good proxy for all the money that has been created — you’ll see that each major increase coincides with another major leg up in the chart above …
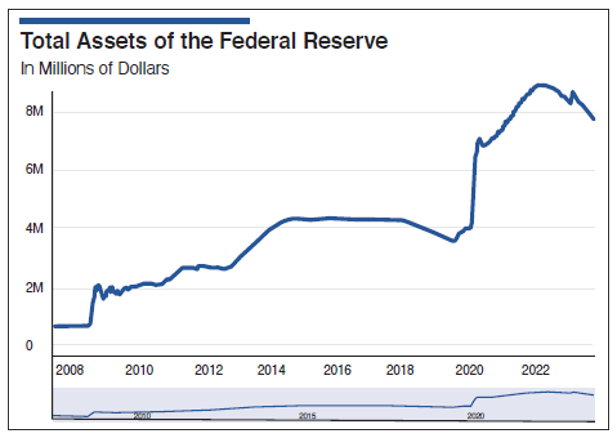
I expect we will see further expansion after the next major market calamity.
That brings me to the third major force I’m watching …
Market Force No. 3: Economic Conditions
If we view the U.S. economy as a person, the country’s vitals look just fine — including the fact that third-quarter GDP growth was recently revised upward to a very hot 5.2% annualized pace.
Yet underneath the skin is a deep sickness, including a huge layer of debt that threatens to stop the nation’s heart at the slightest sign of stress.
A quick checkup proves my point …
Consumer debt has reached a new all-time high above $17 trillion, and the proportion of non-housing debt has widened substantially since 2008-2009.

And the federal government is in even worse shape.
Lawmakers seem completely unconcerned by this startling fact, spending freely … including plenty of money going to overseas wars that don’t even directly involve the U.S.
Thus, we arrive at the last big force we need to watch for 2024 …
Market Force No. 4: Politics/Geopolitics
We already have two ongoing wars in Europe and the Middle East. That’s bad enough.
What’s worse is that either (or both) could end up turning into larger conflicts involving even more countries. Nor should we rule out an entirely new front opening up. For example, China could easily make a more aggressive grab for Taiwan at any point.
Meanwhile, domestically, we are almost certain to see the most contentious U.S. Presidential election in history …
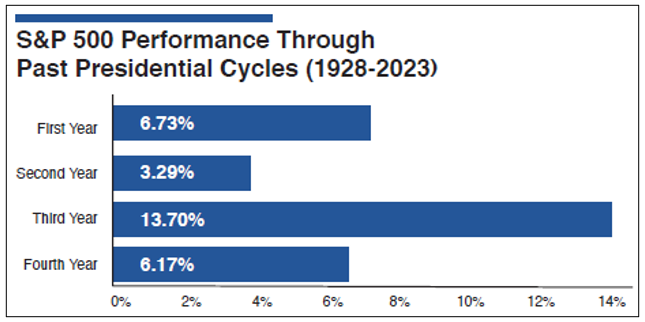
As far as the historical data and what it suggests for the markets, I maintain a very detailed study on the Presidential cycles. Here are several facts to consider:
- From 1928 through the present, the S&P 500 has risen an average of 6.16% during the fourth year of any president’s term. That’s the second weakest year of the four, with the third year typically the strongest by a wide margin.
- The first year under a democrat has typically seen an average gain of 13.1% versus an average loss of 0.78% under a republican.
- However, the S&P 500 performed very strongly in its first year under both Trump (19.2%) and Biden (27.2%).
Obviously, these are very long-term averages with plenty of underlying variance. But they generally align with the idea that 2024 could be underwhelming for equities.
That doesn’t mean trying to find cheap, safe investments is a waste of time. In fact, as I recently told my Safe Money Report Members, I have a roadmap to do just that.
And as I shared with you earlier this month, even seemingly risky investments can actually ADD safety to your portfolio.
For more on this roadmap and specific investment ideas to protect from what is sure to be a wild year, join me by clicking here.
Best wishes,
Nilus
