 |
| By Sean Brodrick |
Gold prices dipped hard on Friday, and gold miners slipped like the rug was pulled out from under them. That’s okay. Let me tell you how you can turn the market’s panic into profit.
On Friday, gold turned sharply lower, falling 1.5% after failing to break the record high of $2,942 that was set earlier in the week.
Still, gold closed above the psychologically important $2,900 level AND closed higher for the week.
On the other hand, gold miners acted like they’d stepped through a trapdoor and fell more than 3%. Some individual miners got particularly clobbered.
This isn’t surprising. Miners are leveraged to the metal. So, it follows that when gold weakens, miners swoon.
For some time, I’ve told my Resource TraderMembers to wait for a pullback before we buy again. That’s because I’ve been trading markets long enough to know nothing travels in a straight line.
Gold is in a bull market, zigzagging its way higher. And the easiest way to make money is to wait for a “zag” lower, then buy.
So, how low can gold go? Here’s a chart …
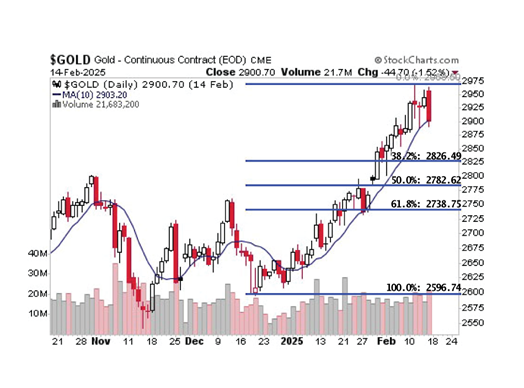
You can see that gold is testing its 10-day moving average. This is important because gold has been walking up its 10-day moving average since January.
Sure, gold could bounce here, as it does regularly. Or, we could get a deeper pullback, one that opens up the bargain bin.
The horizontal lines on the chart are Fibonacci retracements. Without getting too complicated, these are standard levels where support and resistance are likely to occur.
They’re named after the Fibonacci sequence of numbers. These ratios provide price levels to which markets tend to retrace a portion of a move before a trend continues in the original direction.
Pullbacks to the 38.2%, 50% or 61.8% Fibonacci supports would be ordinary. The deeper the pullback, the more bargains we get.
Now, why do I think gold’s bull market will continue? Because nothing fundamental has changed. In fact, the bull case for gold is getting more bullish.
Along with the supply/demand factors including peak gold production, there are new forces at work that are lining up to push gold much higher, like the fact that traders are furiously hedging their portfolios against the risk that U.S. tariffs could trigger a multifront trade war. I’ve told you about more of those forces recently.
Some other forces are starting to show …
China Gold Rush
Chinese banks are running out of physical gold. That’s according to local news agency Yicai. It says 5, 20, 50, 100 and 200-gram gold bars are out of stock at the Industrial and Commercial Bank of China.
Other important banks report varying shortages of bars to sell. Heck, the Postal Savings Bank of China and Bank of China show all gold bars are in “preorder” status. That means no gold bars are currently available.
This may be related to a point I made in a previous article, which is that Chinese investors are using gold to hedge currency volatility. Or it may be something else we don’t know yet.
Gold Hoarding at the COMEX
Investors are buying out London’s gold market and shipping bars to New York’s COMEX exchange. Gold inventories at the COMEX are up nearly 75% since the U.S. election.
Josh Phair, CEO of Scottsdale Mint, told Kitco News, “There seems to be an even greater demand here, almost like there is an unseen hand of somebody that wants a lot of gold and silver in the United States.”
This is probably because investors and traders are getting ahead of tariffs.
Sliding Dollar Buoys Gold
When gold was charging higher, I explained that President Trump’s tariff threats boosted the U.S. dollar in the very short term but weighed on it in the long term. And now, that’s what we’re seeing happen.
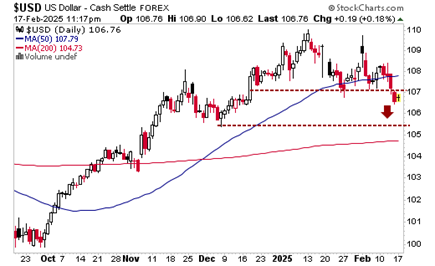
You can see that the U.S. Dollar Index, which measures the greenback against a basket of currencies, broke its 50-day moving average and then fell below support from January.
Support from December would be the next most likely target, but it can go lower.
This matters because gold is priced in dollars. The two sit at opposite ends of what I like to call “The Seesaw of Pain.”
When one goes up, the other gets hurt. The more the dollar slides, the more likely gold will find support.
First, we don’t know how low gold will go in this pullback that runs counter to the big bullish trend. When I see the bottom, I’ll let my members know and tell them what to buy. I have a quiver full of picks ready to let fly.
I’m sure gold is going to hit $3,000 by mid-year — probably sooner than later — and my longer-term target is over $6,000 an ounce! What a move that is going to be for gold AND miners.
To play this, you could buy either the SPDR Gold Shares (GLD) or the VanEck Gold Miners ETF (GDX).
You’ll have to judge for yourself when the bottom is in. Just use those levels I put on the first chart and judge for yourself.
By the way, I will have a brand-new precious metals pick in my Wealth Megatrends monthly newsletter, which comes out this Friday!
If you want to see what the excitement is about — and how we’re taking recent gains of 27.8%, 38.5%, 194.2% and more — CLICK HERE.
All the best,
Sean