What 5% Treasury Yields Are Really Telling Us, and Where the Opportunity Sits

 |
| By Al Qureiyeh |
Everyone is talking about 5% Treasury yields, and most of the talk is worried.
The 10-year Treasury yield closed Tuesday at 5.26%, a level last seen in 2007.
It’s also up a full percentage point (from 4.19%) since the start of this year.
Wednesday’s inflation report came in below forecasts.
The question now is whether that means what it seems to.
What Happened
The Federal Open Market Committee raised its benchmark interest rate by a quarter-point on Sept. 16.
The Fed Funds rate now sits within a range of 3.75% to 4%.
Still, the FOMC stated that "inflation remains elevated."
The 2-year Treasury yield, which tracks expectations for Fed policy, has climbed more than half a point in a month, to 4.89%.
Wednesday’s August reading of the Personal Consumption Expenditures (PCE) price index showed that inflation rose 3.4% from a year earlier.
That was against a 3.7% consensus. The core measure came in at 3% against 3.3%.
The PCE, of course, is the Fed’s preferred inflation gauge.
The same report also changed how the Bureau of Economic Analysis (BEA) measures portfolio management, software and legal services, going back to 2021.
The BEA announced this change on June 24. Forecasters expected this would trim about 0.2 points off core inflation.
July's core reading was revised down, too — to 3% from 3.3%.
Measured the old way, August core inflation would have come in closer to 3.2%, nearly in line with forecasts. (Unless forecasters had already factored in the change.)
So, most of the surprise looks like a change in measurement, not cooler inflation.
Keep in mind, too, that the Fed’s own inflation forecasts were made using the old method.
How the Market Took It
The market's first reaction was split.
Short-term bonds took the report at face value.
The 2-year yield dipped, and the odds of another Fed hike in October fell to just over 1-in-3. That’s down from about half on Tuesday, and more than 70% on Monday.
Long-term bonds ignored it.
The 10-year yield barely budged. The 10-year went between 5.24% and 5.27% intraday against Tuesday's 5.26% close.
So, a softer print did nothing for the long bonds the crowd fears.
What Everyone Is Saying
The mood is gloomy. Nearly half of the investors in the American Association of Individual Investors (AAII) weekly survey are bearish. That’s well above the usual one-third. Plus, most of the bond-market commentary we reviewed leans the same way.
What are investors worried about?
- That a 5% risk-free rate raises the bar for every other investment.
- That bond funds have lost money.
Both of those worries are correct.
Weiss rates two Treasury ETFs as “D,” or SELL — the iShares 7-10 Year Treasury Bond ETF (IEF) and the iShares 20+ Year Treasury Bond ETF (TLT).
So, consider both as caution flags, rather than actionable ideas, at this time.
AAII respondents cited a third worry: the cost to households.
Mortgage rates have climbed along with Treasury yields this year.
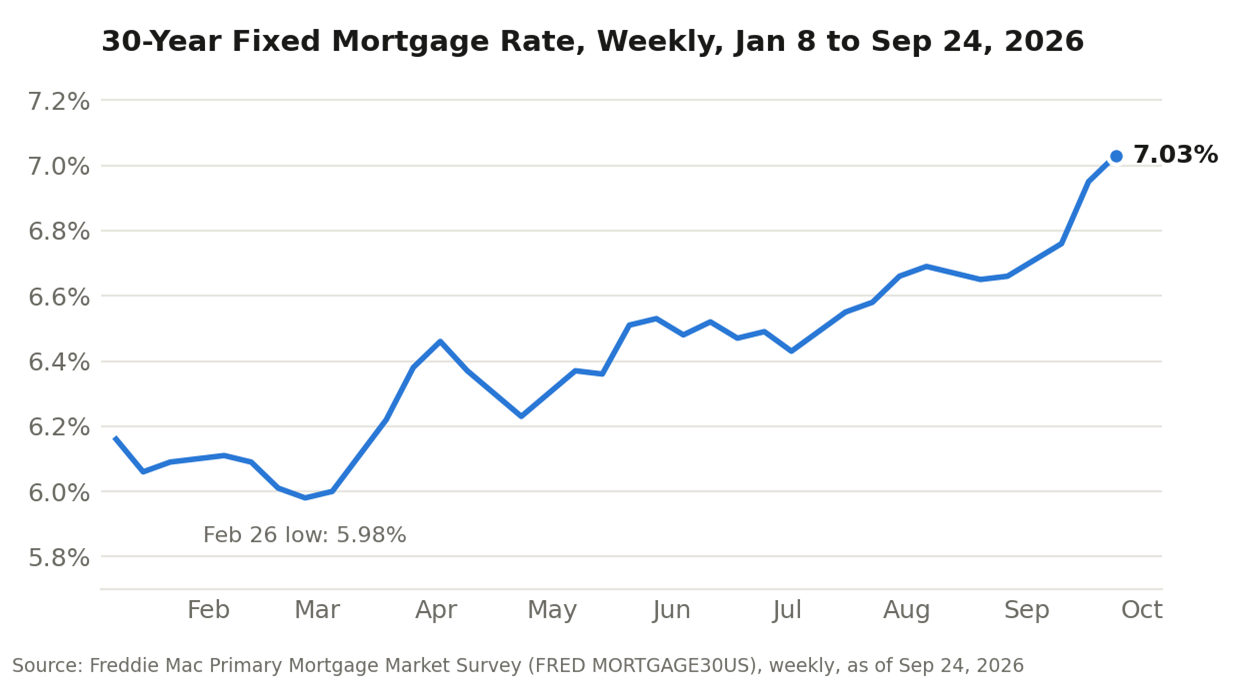
The average 30-year mortgage rate is now just above 7%, up from under 6% in February, according to Freddie Mac.
That was up from 5.98% in late February.
But fear of inflation only explains some of the move.
The bond market’s own inflation forecast — the gap between regular Treasury yields and inflation-protected ones — has barely moved this year, to 2.35% from 2.25%.
Households see it differently. Consumers surveyed by the University of Michigan expect 4.6% inflation over the next year.
We take that gap seriously.
Some commentators call this PCE revision a rewrite that flatters the numbers. But the BEA announced the change back in June, and forecasters had already sized it up.
So, this was a scheduled update, not a surprise.
What the Crowd May Be Missing
Here’s what most of the commentary misses. Treasury Inflation-Protected Securities (TIPS) show what bonds pay after inflation.
The 10-year TIPS yield has risen almost a full point this year. That’s about 90% of the regular 10-year’s increase.
So, the rise is a higher real yield, paying investors more after inflation rather than for more of it.
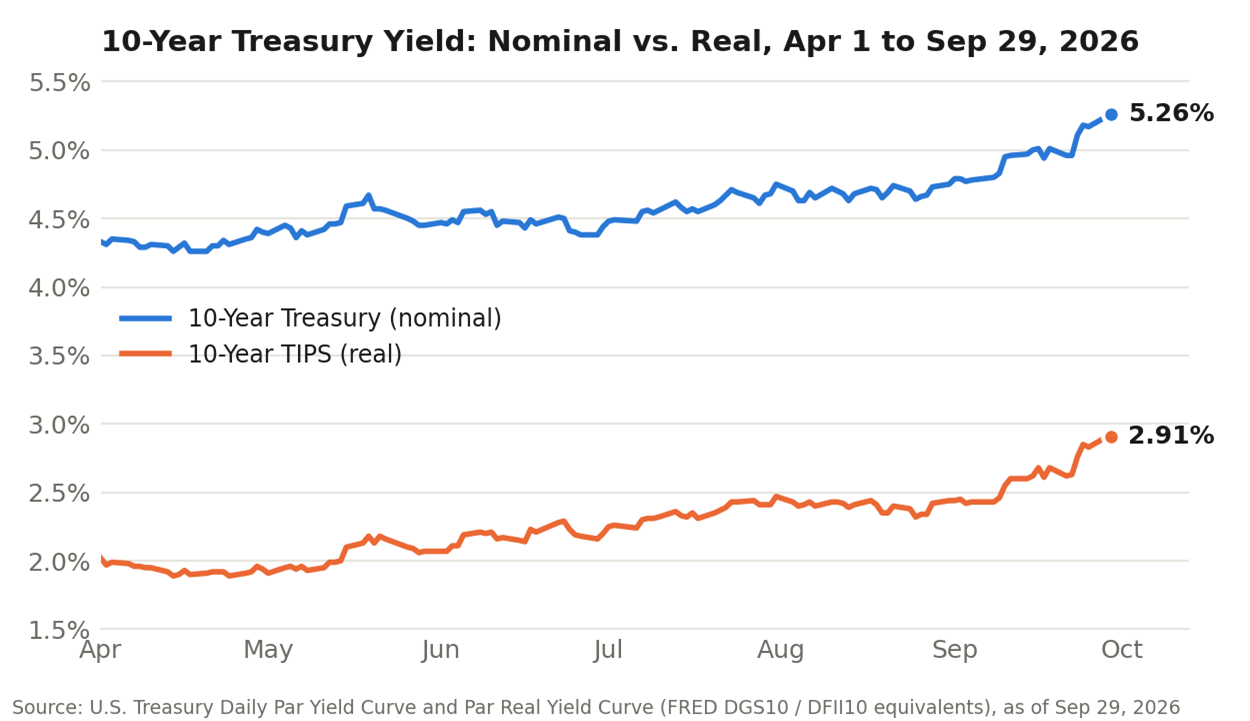
The 10-year Treasury yield and the inflation-protected (TIPS) yield have risen together this year.
So, the gap between them — the market's inflation forecast — has barely moved. (It went from 2.31% on Aug. 28 to 2.35% on Sept. 29.)
The rise has come in two phases.
Over the past month, short-term yields led the way as investors priced in more Fed hikes.
Over the past week, long-term yields took over. The 30-year yield rose far more than the 2-year, and a Fed estimate of the extra return investors demand for holding long-term debt rose, too.
That second phase fits the crowd's worry about heavy government borrowing.
And Wednesday’s report, measured the old way, does little to undercut the first.
Where We See Opportunity
Our first idea is the 2-year Treasury note, which yielded 4.89% at Tuesday’s close and matures before most of the risks facing long-term bonds have time to play out.
What could work against the 2-year is a Fed that keeps raising rates, which the market hasn’t ruled out. But if you hold the note to maturity, you still collect the yield you bought it at.
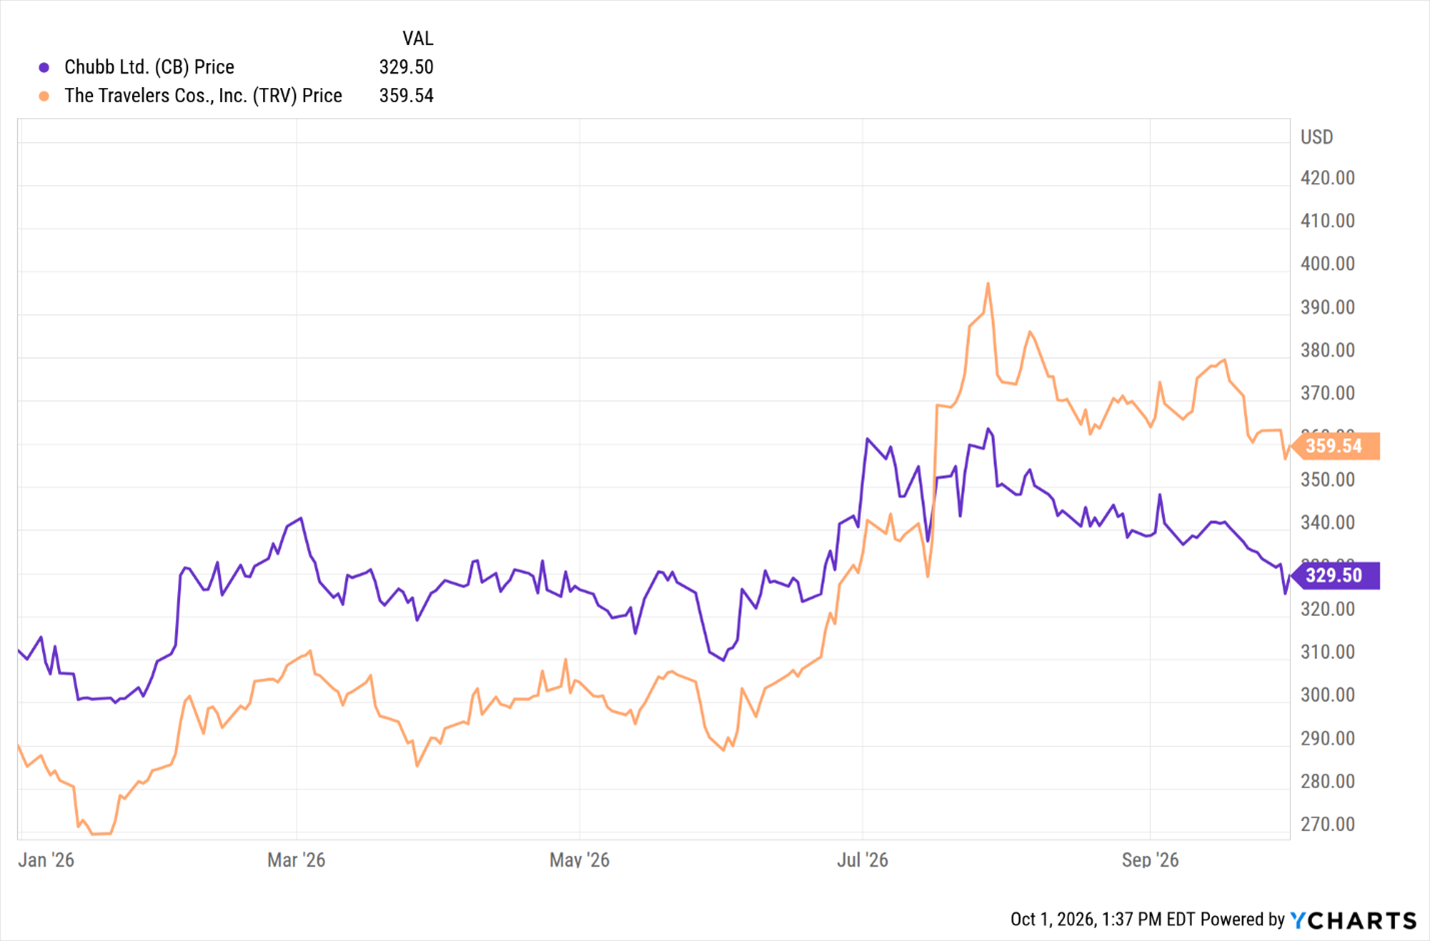
Our second idea is property and casualty insurers. They collect premiums up front and invest that money in bonds that now pay about 5%.
Insurance stocks have lagged lately. The SPDR S&P Insurance ETF is down about 7% this month, while the S&P 500 is down less than 1%.
We looked at three past periods when real yields jumped sharply. The two insurers below beat the S&P 500 in two of them, mostly by holding up better when the market fell.
Chubb (CB) carries a Weiss Rating of “A,” or “Buy,” with Excellent scores for growth, efficiency and solvency.
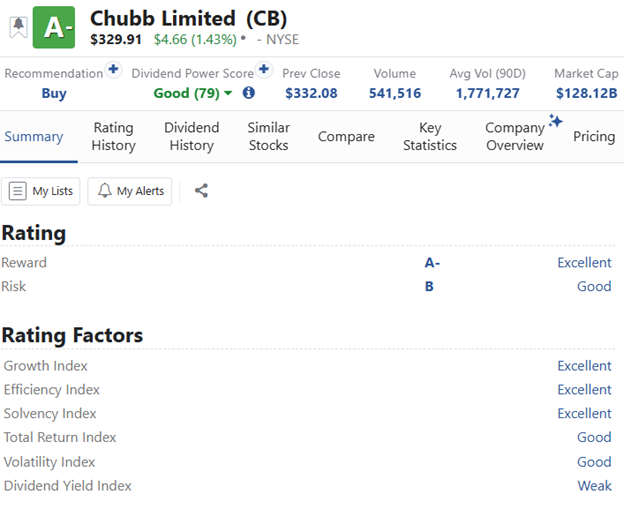
It closed Tuesday at $332.08, just above its 200-day moving average, a common gauge of the long-term trend.
What could work against Chubb is softer pricing for commercial insurance, and paper losses on its bond holdings as rates rise.
Travelers (TRV) is also rated “A,” or “Buy,” with an “A-” on the Weiss Risk sub-grade.
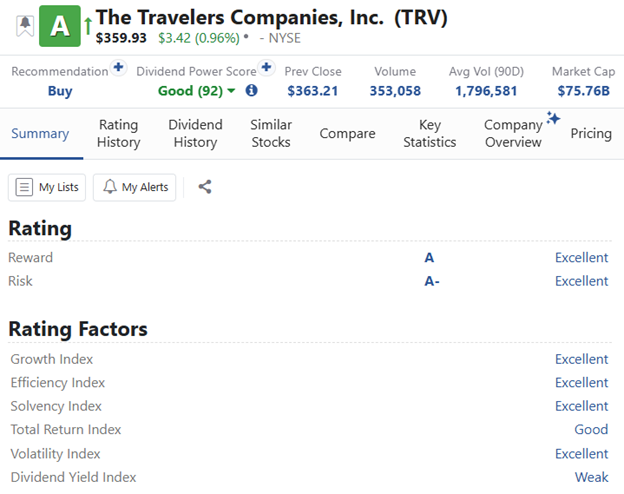
It closed at $363.21, up 10% over the past three months, compared with about 2% for the S&P 500.
What could work against Travelers is a shrinking personal insurance business, and growing paper losses on its bond holdings as rates climb.
The two ideas also balance each other.
If yields fall sharply, the 2-year note gains while insurers may give back some ground.
If the Fed keeps hiking, the note suffers while insurers reinvest at higher rates.
What We're Watching
Three economic reports:
- The September jobs report on Friday, Oct. 2.
- The Consumer Price Index (CPI) on Wednesday, Oct. 14.
- And the Fed’s next decision on Oct. 28 — the day before the next PCE report.
We’d change our view if the 10-year TIPS yield closes back below 2.63%, where it stood on Sept. 22.
Related story: How to Get Paid No Matter What Friday’s Jobs Report Says
We’re also watching the gap between 30-year and 2-year yields. It widened this past week.
If that gap narrows back to where it was a week ago, this would suggest the extra premium on long-term bonds is fading.
Bottom Line
The 5% yield everyone is worried about is mostly a higher real return. And Wednesday’s inflation report looks softer mainly because the measurement changed.
The market split the difference. It trimmed the odds of an October hike but left the 10-year yield alone. So, the Fed is still in play, and so is the extra premium on long-term bonds.
So, we’d take the yield where the risk is smallest — in the 2-year note and in insurers paid to hold bonds — and let everyone else keep talking.
Take care,
AL Qureiyeh