Precious metals have trounced other commodities recently.
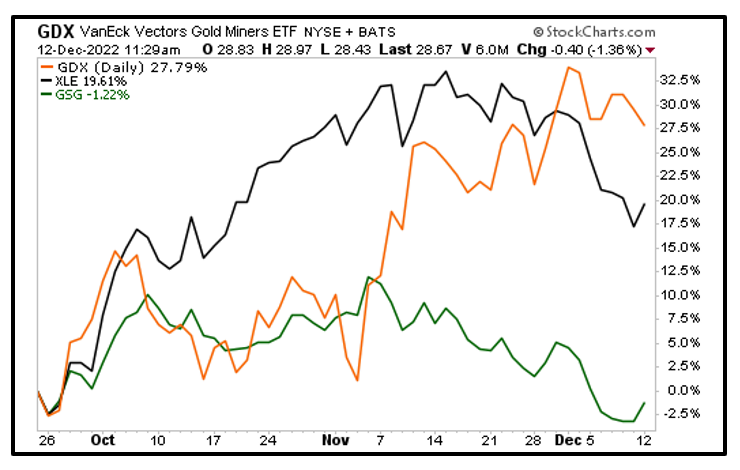
Since a recent bottom in September, gold miners tracked by the VanEck Gold Miners ETF (GDX) are up 27.5%!
That outperforms the leading oil stock ETF, the Energy Select Sector SPDR Fund (XLE), which is up only 19.6%.
And the broad-based iShares S&P GSCI Commodity-Indexed Trust (GSG) is actually down a little more than 1%!
But don’t just take my word for it — take a look at GDX’s chart …
Click here to see full-sized image.
Yeah, it sure looks like something has lit a fire under gold. It’s no surprise to you if you’ve been reading my Wealth Wave articles.
You saw my columns, “Gold & Silver Soar as the Market Panics” on Oct. 4, “3 Reason Gold Can Rally” on Nov. 8 and “Let Your Gold Flag Fly” on Nov. 22. I gave you plenty of reasons why gold was on the launch pad, and I gave you charts to back that reasoning up.
Now, let me show you one gold chart to rule them all.
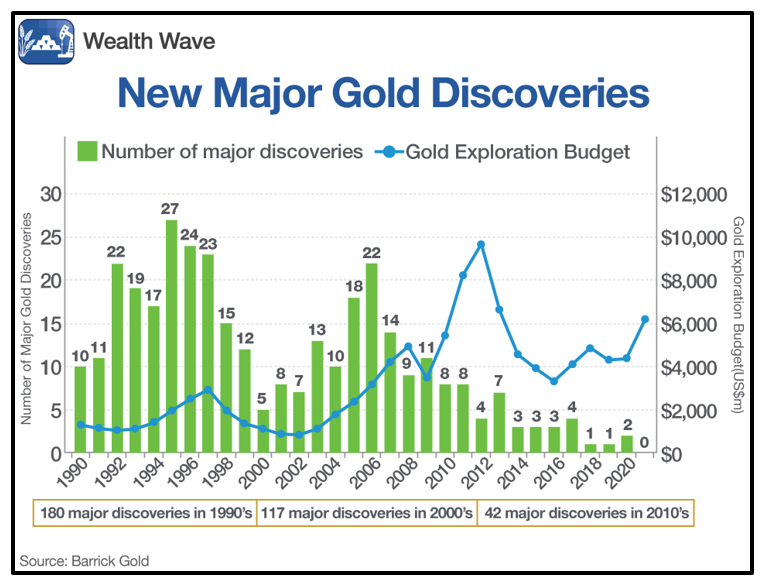
This comes from Barrick Gold (GOLD), a company that knows a thing or two about precious metals.
This is a chart that shows major gold discoveries through 2021. It turns out the world’s miners just aren’t finding deposits the way they used to …
Click here to see full-sized image.
The lack of discovery success isn’t for lack of trying. That blue line shows gold exploration budgets. Spending on exploration is actually going up, while companies find less and less.
And gold is a depleting resource. We better hope gold miners find some more deposits. Otherwise, prices are going to the moon.
I think the market can sense this. To be sure, it’s in the numbers. The World Gold Council recently released its Gold Demand Trends report for Q3. Total gold supply — including recycling — increased 1% year over year, to 1,215 metric tons.
At the same time, overall gold demand soared 28% higher, to 1,181 metric tons. And gold demand is up 18% versus a year ago.
Simply put, we’re at “Peak Gold.” In the good ol’ days, global gold production rose, on average, 1.8% per year. That stopped in 2020, when total gold supply fell 4% year over year.
The verdict isn’t in for 2022 yet, but Q3 production numbers are in for the big miners and that’s down another 4%.
When you have less supply of something, and demand stays the same or increases, prices generally go higher. There are a lot of reasons for gold to go up — including that the U.S. dollar has lost 90% of its purchasing power since 1950 — but tightening supply seems to be the overriding force.
The cupboard is bare, gold is going higher and miners leveraged to the metal are on the launch pad. The GDX is an easy way to play it. Or you can roll up your sleeves, crunch the numbers and drill down in individual stocks.
My target on gold remains $2,931. That’s a nice move from current prices. I’ll see you there … and I hope you come along for the ride.
All the best,
Sean
P.S. If you still haven’t joined my friend and colleague Tony Sagami’s Disruptor’s & Dominators, now is the perfect time. You can grab some end-of-year gains, just like members of his service who are currently sitting on open gains of 39%, 30% and 18%!