Bitcoin Confirms New Bull Cycle Has Already Begun

 |
| By Juan Villaverde |
If you’ve been following my Friday updates, you’ll know I find Japanese liquidity (JpM2) to be one of Bitcoin’s (BTC) strongest near-term indicators.
Bitcoin tends to follow JpM2’s lead with about a 3-month lag.
JpM2 blends two things.
- First, the amount of money flowing out of Japan, in yen.
- Second, the USD/JPY exchange rate. That exchange rate is what really moves the chart.
Here's what that means: When the dollar weakens against the yen, Japanese liquidity rises.
Then, about three months later, crypto rallies.
When the dollar strengthens against the yen, crypto falls three months later.
Now, after a full year of dollar strength against the yen, that trend is finally turning.
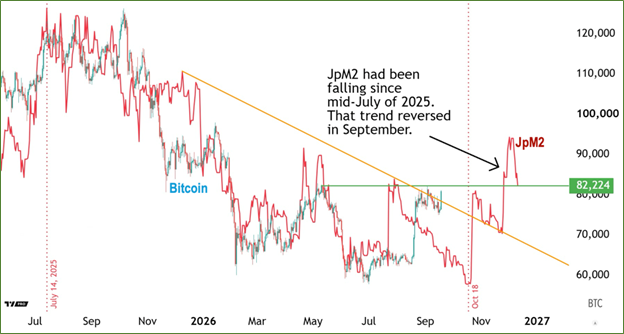
JpM2 is the strongest signal I've found for crypto.
(That said, there are short-term deviations, like the one we're in one right now. More on that shortly.)
It won't give you exact price targets. But it will tell you the direction of travel. When the red line (above) climbs, crypto tends to do well.
When it falls, crypto tends to struggle.
Now look at the two dashed lines on the chart: July 14, 2025, and Oct. 18, 2026. Between those two dates, Japanese liquidity fell steadily.
But here’s the key takeaway: That whole stretch of falling Japanese liquidity was crypto’s bear market.
The two line up almost perfectly.
And yes, there were a few short rallies along the way. Those rallies line up almost exactly with the "bear market rallies" we saw in Bitcoin in that stretch.
One hit in January 2026. Another came in April. The current one started with a double bottom between June 25 and July 1.
It's technically still running, though I expect a local top to be confirmed soon.
The yellow diagonal downtrend line tells us why: It marks a bullish breakout on Japanese M2.
That breakout follows a low, which should hit on the week of Oct. 19. So, we should start to see prices correct ahead of that.
It's already been confirmed. Nothing that happens with prices going forward can undo this.
Now, turn your attention to the green horizontal line. That marks Bitcoin's last confirmed 320-day-cycle high. And why JpM2’s latest data has now become the most bullish signal we've seen all year.
See, a push above that level confirms the bull market is fully underway.
As of this writing, Bitcoin been trading above it for about two weeks. Which means I can now confirm that the bear market has ended.
We’re officially in the first days of the next bull cycle.
That said, I did mention a recent divergence between BTC and JpM2. Here’s what that means …
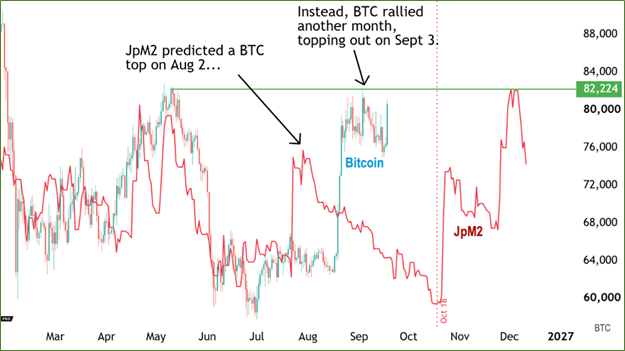
Hint: It’s actually good news.
JpM2 initially pointed to a BTC top around Aug. 2 and a correction into Oct. 18.
Instead, the rally kept running for another month, eventually leading to Bitcoin finally breaking above resistance near its previous 320-day-cycle high.
A bullish split like this usually means one thing: The bull market is warming up faster than expected. And should accelerate further heading into 2027.
That's good news. Especially for anyone who used the bear market to their advantage and loaded up at discounted prices.
This answers a question I get a lot. Namely, does Bitcoin pulling away from Japanese M2 mean the signal stopped working?
Answer: No. Short-term splits happen.
When they do, I then turn to my second-best indicator, U.S. Treasurys. But BTC and liquidity always snap back into line eventually.
I expect the same to happen this time by mid-October.
Here's why this good news. What looked, at first, like a long, early August to mid-October correction … morphed into something totally opposite: One of the sharpest rallies of 2026.
That means the worst case right now is … prices keep drifting sideways.
Then they build enough strength to break higher in the second half of next month.
Before that happens, you’ll want to have your crypto strategy locked in.
This way, you can spot the right moment in the coming weeks to get your portfolio ready for the next bull run.
Best,
Juan Villaverde
P.S. Every investor knows your strategy is only as good as the data you build it on. That’s why I’m constantly retesting and improving my Crypto Timing Model.
My colleague Chris Graebe is in a similar boat on the TradFi side. In fact, he’s recently put Weiss’ data to work to identify the 10% of IPOs that actually reward first-day investors.
And testing shows it beat the average IPO 25-to-1.