 |
| By Juan Villaverde |
For months, I’ve been obsessed with different forms of liquidity.
Why?
Because they have a unique predictive ability when it comes to Bitcoin (BTC, “A-”) and crypto prices.
Put plainly, we can get a glimpse of what’s in store for Bitcoin — and by extension the broad market — by paying close attention to liquidity indicators.
Whether we use Global M2, the worldwide stock of money and credit …
Or Asian Liquidity, which I recently identified as the best predictor of Bitcoin prices …
Or the more restrictive Central Bank Liquidity (CBL), which Bitcoin has been tracking throughout 2025 …
The fact remains that global liquidity is an incredible predictor of crypto prices for one simple reason: Bitcoin typically lags liquidity by about three months.
This simple indicator has worked remarkably well throughout the current four-year cycle. It has helped me anticipate every single 320-day cycle correction.
These are Bitcoin’s multi-month sell-offs that occur during every bull market. And thanks to liquidity indicators, I’ve been able to see them coming months in advance.
Liquidity as Crypto’s Crystal Ball
Even more powerful is the combination of Global Liquidity and my own Crypto Timing Model. That’s because together, their two-pronged approach creates the closest thing to a crystal ball I’ve ever seen.
- Liquidity reveals the likely future path of prices,
- Meanwhile, my model fine-tunes the timing of the major turning points.
Together, they paint a more complete picture of Bitcoin’s moves … before they happen.
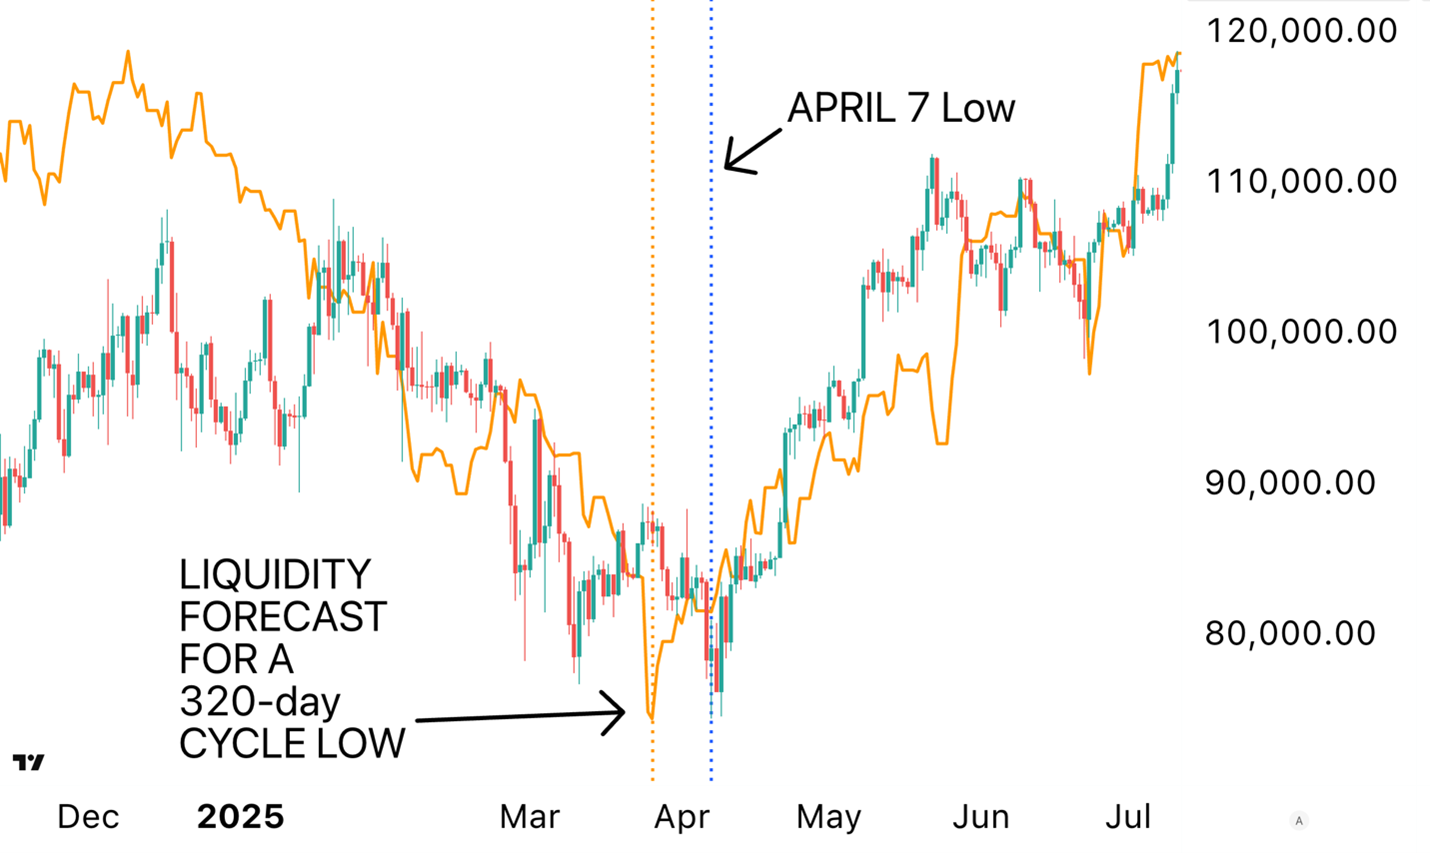
For example, back in late March and early April, liquidity was showing a prominent low around March 26. At the same time, my model pinpointed April 7 as the biggest low of the year.
Sure enough, Bitcoin bottomed exactly on April 7.
But it was Global Liquidity that revealed the importance of that low. See below:
The best part? The model is still relatively new and continues to improve over time.
Still, the trader in me had to ask: “Is there a time when liquidity is a bad predictor of future crypto prices?”
Having worked with predictive models my entire professional life, I know that no model is perfect. Even the best forecasts break down under certain conditions.
The same applies to liquidity.
Global Liquidity’s Blind Spot
My research shows that while the model works phenomenally well most of the time, it consistently fails around one critical juncture: Bitcoin’s four-year cycle top.
That is, Bitcoin’s top over the course of four 320-day cycles.
And in fact, liquidity has never accurately predicted a four-year cycle top.
Sometimes Bitcoin tops alongside liquidity, as it did in November 2021. Other times, Bitcoin peaks months before liquidity does. That’s what happened in late 2013 and 2017.
Knowing this, I’ve made it a rule to constantly monitor whether Bitcoin begins to deviate negatively from liquidity.
In other words, I take note if Bitcoin starts to drift lower while liquidity remains strong.
Why?
Because that’s the lesson I learned from Bitcoin’s November 2021 top:
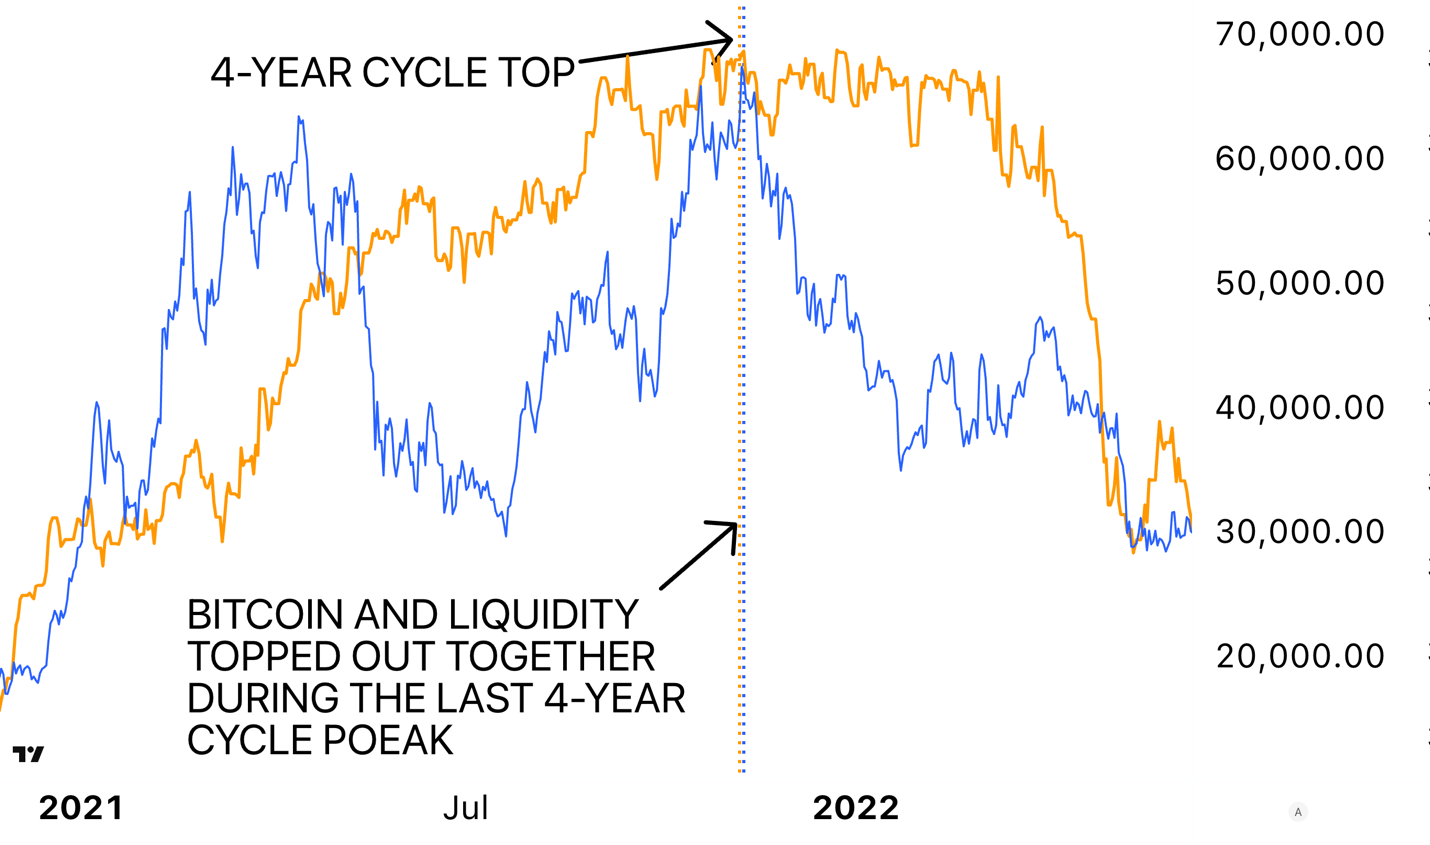
Above, you can see Bitcoin (in blue) versus Central Bank Liquidity (in orange). But this time, I’ve charted them without the 84-day offset.
In other words, this is real-time liquidity, layered directly over Bitcoin’s price.
Both moved together around the time of Bitcoin’s last confirmed four-year cycle peak.
The lesson for the current cycle is straightforward: If Bitcoin begins to deviate from liquidity with an 84-day lag, we must check whether Bitcoin is now following liquidity in real time.
Because that pattern often signals an incoming four-year cycle top.
Unfortunately, that’s exactly what’s happening now:
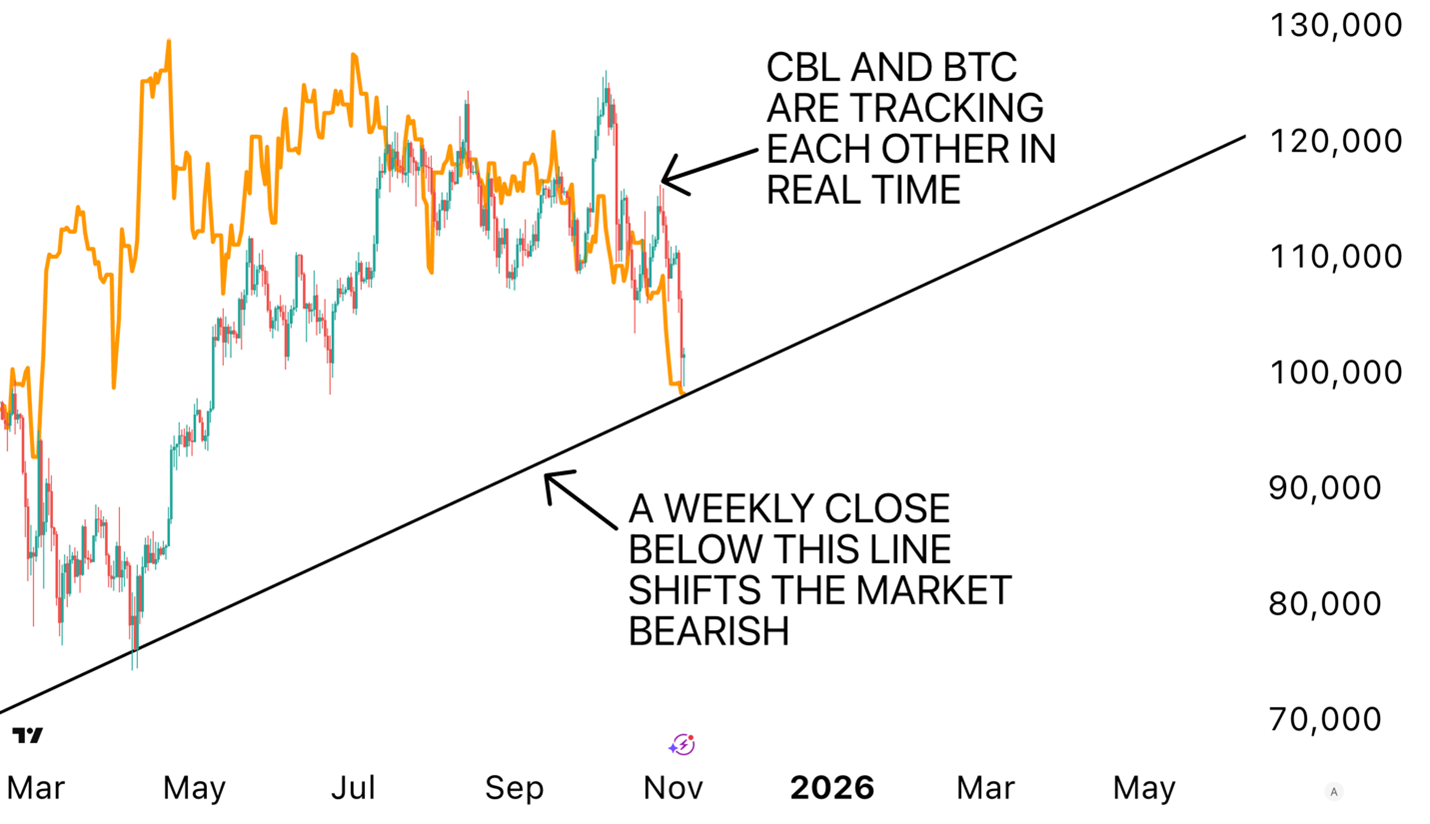
Above is a chart of Bitcoin, with the solid orange line representing real-time Central Bank Liquidity.
As you can see, Bitcoin is no longer following liquidity with a delay. It’s reacting to it in real time. Just as it has during past four-year cycle peaks.
This is not a good sign.
It indicates that the bull run may be in its final stretch.
Especially when you consider this chart’s other warning: Liquidity shows no signs of recovery. It’s been declining for months.
And my Crypto Timing Model indicates Bitcoin will likely remain directionless during this period, with a heightened risk of further downside ahead.
For investors and traders, the alarm should be ringing.
While we don’t have confirmation that the four-year top is behind us, we do know that the coming weeks will likely be volatile, with the potential for more downside pressure.
This makes de-risking the smart course of action — regardless of how we feel about the long-term market outlook.
That’s why I told my members to harvest their gains and de-risk this week. We’re not out of the market entirely, but we are not as exposed as we have been.
A Few Caveats
Despite my decision to de-risk and prepare for a choppy Q4, I don’t want you to think the game is up.
There is still plenty in store for crypto in the coming months.
My goal is to keep your capital — and your earnings — safe until the market recovers. That’s what my latest alert is all about.
In fact, to better understand the outlook above, there are two key caveats to understand.
No. 1: My model is NEUTRAL for Bitcoin.
My Timing Model has been NEUTRAL since late August, and the latest sell-off hasn’t changed that. Which means this bull market is not officially over.
Only a weekly close below $96,000 would flip the model to BEARISH. That would then be our sign that Oct. 6 was Bitcoin’s four-year cycle peak.
We’re not there yet. Which is why I haven’t completely stepped away from the crypto market.
That said, we are closer than I would like to see.
No. 2: The liquidity outlook for 2026 is actually positive.
This has been a strange four-year cycle.
Some claim the cycle is “over.” But, as you can guess from the first caveat, I disagree.
What I do expect is that the next down phase may not resemble a traditional bear market.
Bitcoin could stabilize between $70,000 and $90,000 for several months before the next bull leg begins. That would represent a far less severe correction than past bear markets, which saw 80%+ drawdowns.
This scenario aligns with liquidity turning positive again in 2026.
Still, the weakness expected over the next three months should not be underestimated. And it’s a compelling reason to de-risk now.
This way, you are safely out of the fray should the down phase intensify.
Looking Ahead
What should we expect from Bitcoin between now and year-end?
For now, keep an eye on $96,000.
A weekly close below that level would be decisively negative and would force us to liquidate the remaining positions.
Note, however, that we’re about 70 days into the current 80-day cycle, so we should expect a moderate rally over the next 20 days or so.
How strong that rally is — how soon it begins, and from what price level — will determine our next move.
As for my Crypto Timing Model, there isn’t much of note for November, though there’s a small chance of a meaningful low between Nov. 6 and Nov. 20, with the latter being the more likely date.
The biggest remaining reversal of 2025 comes on Dec. 10, which is likely to mark Bitcoin’s next 80-day-cycle low. The November dates could bring minor bounces on the way to that December low.
And in the meantime, risk adverse investors may want to consider de-risking accordingly.
Best,
Juan Villaverde
P.S. How you navigate this market uncertainty will depend heavily on your specific strategy.
Are you a near-term trader looking for small, quick gains? This volatility could work in your favor, offering opportunities to hop in and out of quick bounces off support levels.
But if you’re a long-term, “buy-and-hold” investor, knowing when to hold, when to fold and when to harvest wins can be tricky.
That’s exactly what my Crypto Timing Model helps you nail down. To learn how it can help your investment strategy, click here.
