Bitcoin's Next Rally Could Start Near $80,000

 |
| By Juan Villaverde |
As a cycles analyst, I understand that timing, not price, guides the crypto market. Which is why our trading strategy relies so heavily on Bitcoin’s drumbeat.
And it’s why I use a variety of indicators to stay a step ahead of Bitcoin’s (BTC) next moves.
But I’m never satisfied with just one stream of data. After all, Bitcoin’s recent deviation from liquidity reveals the importance of having multiple indicators.
That’s why I designed a new tool. An indicator I’ve decided to name Fair Value. It built on a ratio called MVRV: market value versus realized value.
- Market value is what Bitcoin is worth at today’s price.
- Realized value is what the network is worth on-chain, with every coin valued at the price it last moved — rather than today’s price.
Think of the Fair Value reading as roughly what holders, in aggregate, paid for their coins compared to the value of those coins today.
The result is a simple number that tells us whether the market is overbought or oversold.
My goal with this tool is that it can confirm what liquidity suggests will happen based on on-chain data.
Here’s how …
When market value sits well below that on-chain value, the average holder is underwater. That tends to reduce selling pressure.
And it almost always marks bear market lows.
When it sits well above, the average holder is sitting on big gains. That makes holders more likely to sell. And as a result, high readings often line up with market tops.
Oftentimes, it specifically indicates a bull market top.
Just look at Fair Value when applied Bitcoin’s historical data …
Bitcoin’s Fair Value Indicator
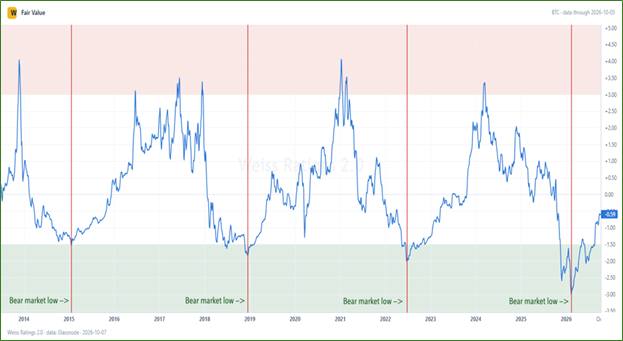
In 2015, the reading bottomed at -1.5. In 2018, it bottomed at -1.8. In 2022, it bottomed at about -2.
Cycle after cycle, bear market lows clustered in a tight range showing negative Fair Value readings.
But let’s zoom in to the latest cycle for a clearer picture …
Starting in Q4 2025, using liquidity and the bond market, I was pointing to February as a potential bear market low, and then to a retest of that low around June or July.
CBL and T-bonds Anticipate a February Low
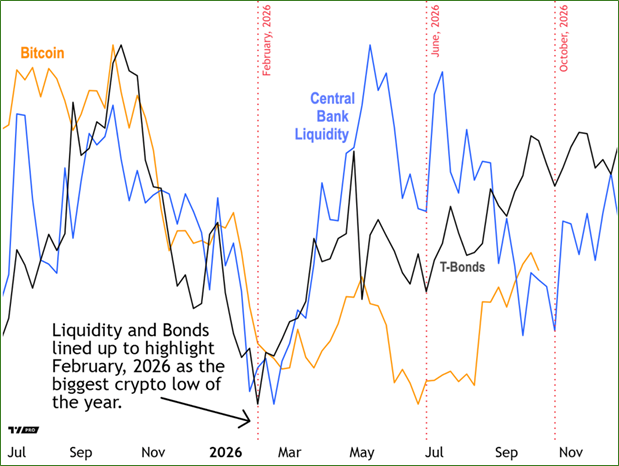
In this chart, you can see how the 10-year Treasury and Central Bank Liquidity both line up to forecast a low in February 2026. That’s marked by the first red dotted line.
Looking back, my Fair Value indicator hit -3 at that time. That is the most oversold reading in all the data I have, which goes back to 2013.
Sure enough, Bitcoin made a significant low on Feb. 5 at about $60,000. That was within ~$2,000 of BTC’s bear market low at the June/July retest, which you can also see marked by the red dotted lines.
(Prices in the June/July low did slightly undercut the February low, but they never closed with confidence below it. Which means February remains the most important low of this bear market. And you can see the same in the chart above.)
What’s amazing to me is this: The on-chain data called this the deepest washout Bitcoin has ever seen. While price alone made it look like a mild bear market.
This is why I keep hammering on in these updates how important it is to look beyond raw prices.
Too many people thought Bitcoin was headed to $30,000 this past cycle. But that was only because it usually corrects by 80% from the top.
As if we haven’t already observed that each cycle’s amplitude — that is, how large the range between peak and valley — has changed in each progressive cycle!
Rallies in each bull market have been getting smaller. And we’ve just closed out the mildest bear cycle on record.
Macro indicators told the same story. And they did it ahead of time.
Now, look at the red dotted line to the far right of the chart. That indicates the macro indicators’ next predicted low, set for later this month.
Of the three, you can see this one is set to be the mildest. Bonds barely show a correction in this period. I discussed this in more detail last week.
My forward-looking macro indicators and my new Fair Value indicator, which reads the on-chain metrics, agree on this.
I don’t want to oversell Fair Value. It isn’t a forward-looking indicator. So, think of it more like a measuring stick, not a timing tool.
What it did was confirm from the on-chain side what the macro indicators were already telling us.
That’s why I use all my tools — macro and on-chain — in concert!
So, where does that leave us now? At the start of a mini correction. And that’s really all we can call it at this point.
It should take us into a low in the second half of October, and it’s already underway …
Bitcoin’s Daily Chart with JpM2
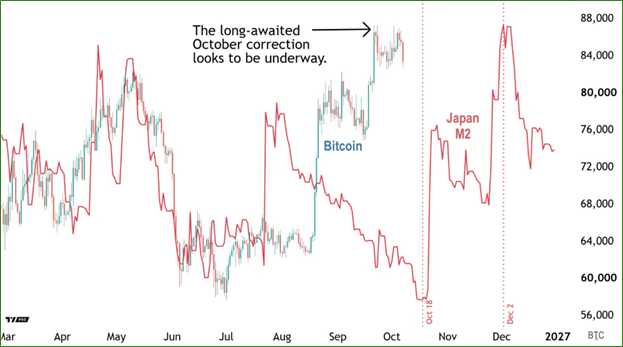
From there, Bitcoin should continue higher into a high in early December.
That outlook has not changed. What has changed is that the downside we should have been expecting all along seems to have arrived.
It just came in even more quietly than anticipated.
Remember: My indicators are timing predictors, not measurements of future price action. So the price target is my own read, based on my analysis of Bitcoin’s moves.
So, how deep do I see this correction taking us?
Not far, to be honest. I expect Bitcoin to dip to about $80,000 within the next 10 to 20 days at most, with 15 days the most likely duration.
From there, it should pick up momentum and head back higher.
As I say that, I do have one caveat to note: This is not the big correction I’m expecting.
The big correction, according to my forward-looking indicators, runs from the November/December top into at least January. All my indicators put with bigger low sometime in January or February.
And with that comes your next best buying opportunity.
So, sit tight for now. While you wait, you’ll want to pinpoint your target entry prices. This way, you’ll know exactly when to load up.
Or, you can always check out my Weiss Crypto Investor newsletter. That’s where long-term crypto investors can benefit from buy and sell recommendations that come straight from my Crypto Timing Model.
Best,
Juan Villaverde