 |
| By Bruce Ng |
Last week, Grayscale Investments emerged victorious in its battle against the SEC.
The SEC had previously rejected the crypto asset manager’s proposal to convert its Grayscale Bitcoin Trust (GBTC) into a spot Bitcoin (BTC, “B+”) ETF.
Then on Sept. 2, a federal judge said the SEC must revisit its decision. This favorable ruling gave cryptos a much-needed boost, and for good reason.
After all, if the SEC does ultimately approve Grayscale’s request, this could open the door to more spot-based crypto ETFs. And, in turn, potentially huge cash inflows from mainstream and other investors.
In the meantime, the SEC did make a decision. That was, to delay the spot ETF applications of six other firms — WisdomTree, Invesco Galaxy, Valkyrie, VanEck, Bitwise Asset Management and Fidelity — into October.
We will keep a close eye on this developing story and let you know what the SEC decides … and the impact it ultimately has on crypto prices. In the meantime, it’s looking like that morale boost was short-lived.
Going into the Grayscale decision, we wrote in last Tuesday’s issue that Bitcoin could pop to $27,000 to $28,000. But we expected this rally would only be temporary, at most one to two weeks.
We got the rally to $28,000 on Aug. 30.
Bitcoin rallied to $28,000 going into the Grayscale decision but has since pulled back.
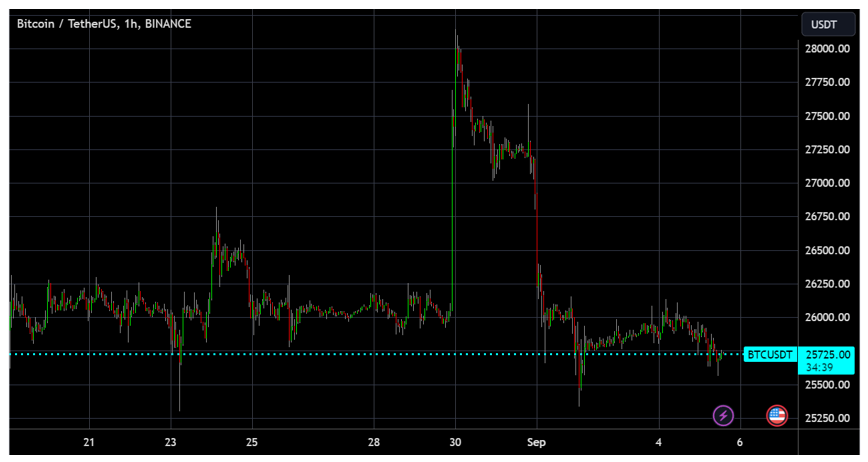
Click here to see full-sized image.
But instead of lasting one to two weeks, it only lasted two days. And per last week’s forecast, we are now expecting more downside in the ensuing months.
How much more downside? Let’s take a look key levels of support/resistance for that answer.
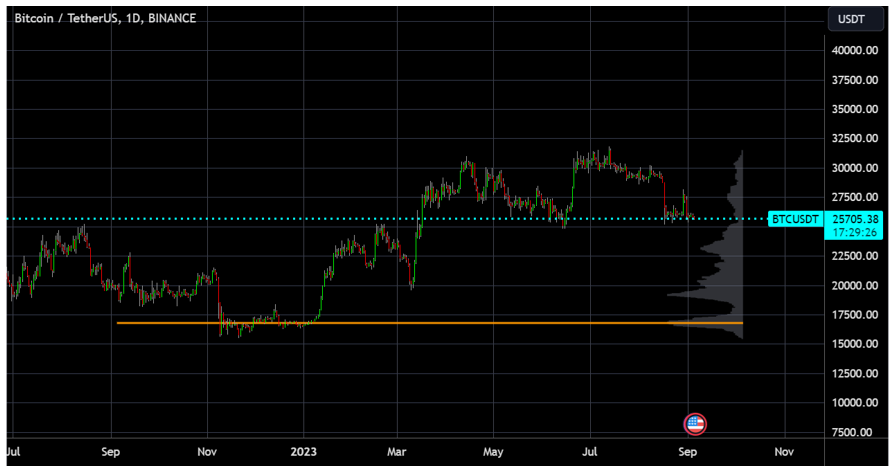
Click here to see full-sized image.
The rotated bar chart on the right shows the volume profile of the time range (spanned by the horizontal orange line) for BTC over the past year.
The volume profile used to identify price ranges where most of the trading action happened. It can identify significant levels of underlying support or overhead resistance.
We can see that the $25,000 level is a weak one due low trading volume on the volume profile. Whereas the $23,000 level is a strong one.
This means that if Bitcoin were to head to $25,000, there is a strong chance it might drop to $23,000 shortly thereafter.
Again, let’s consider the monthly performance of BTC for each year. See below.
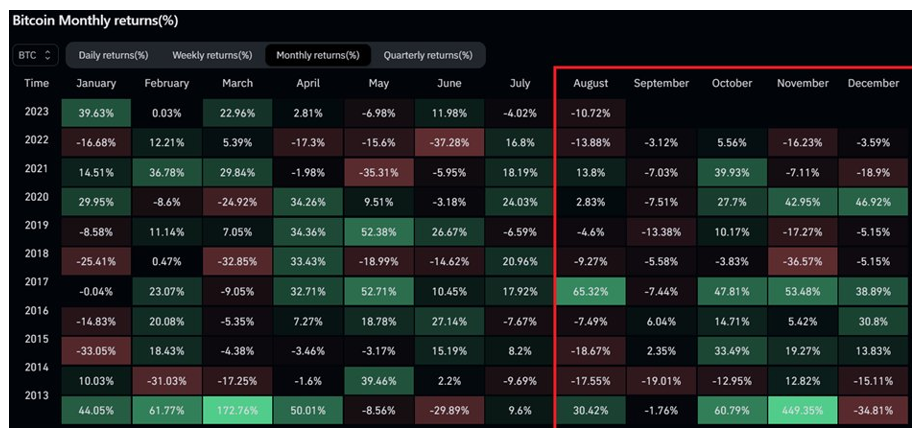
September is usually a bearish month. Most years, things only start to pick up around October.
The Ethereum to Bitcoin (ETH/BTC) price chart is a good indicator of future altcoin performance.
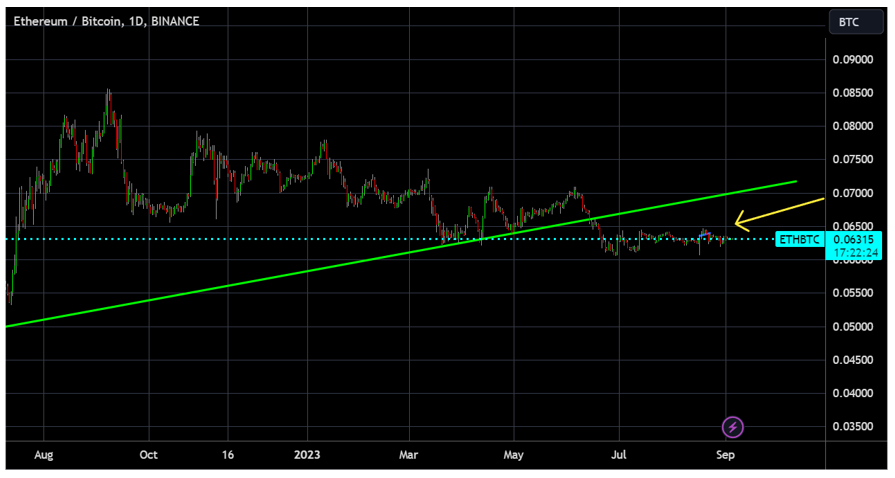
Click here to see full-sized image.
As for ETH/BTC, nothing much has transpired. It is still trading sideways albeit steadily below the green multi-year trendline.
If BTC dips, we expect alts to dip, as well.
Price and volume only tell part of the story. There are two other indicators worth watching that measure sentiment: open interest and the Long/Short ratio.
Open interest measures the number of outstanding derivatives contracts for an asset. Crypto open interest is now valued at $10.4 billion.
That’s in the mid-range, not overly high nor low. But still high enough to do some damage if we get a liquidation cascade.
The Long/Short ratio gives you a look at how many accounts are net long vs. net short crypto. It’s currently at 56%/44%, which tells us that there are significantly more longs than shorts.
The Long/Short ratio is currently at a record level high for the year. This tells us that the chances of a long squeeze — i.e., BTC going down — are going higher.
Here are four more takeaways for you today:
- Keep an eye on open interest. If it increases, and the Long/Short ratio continues to be high, we might get a long squeeze that will spark Bitcoin to drop to $25,000 from its current level around $25,700.
- Observe the $25,000 level. Bitcoin has poor support at $25,000. A breach of that level will likely lead to a drop to $23,000.
- Watch altcoins carefully. If BTC drops, the alts and ETH will drop more.
- Expect September to be a bearish month. If any recovery were to occur, it would come around October. This expectation is based on BTC’s performance over the past 10 years.
How should you play it? Frankly, I can’t think of a better way to play both the ebbs and the flows of the crypto market than to follow the signals that Juan Villaverde’s Crypto Timing Model throws off every single day.
In his Weiss Crypto Portfolio service, Juan helps subscribers identify the most optimal times to buy and sell Bitcoin, Ethereum and other blue-chip cryptos, as the best prices as identified by his model that’s based on his decades of studying crypto and other market cycles.
Take this service for a test-drive today. Start here.
Best,
Bruce