Make Bitcoin’s Déjà Vu Moment Benefit Your Portfolio
 |
| By Juan Villaverde |
Bitcoin’s (BTC, “A-”) recent spot price action proves once again that for a full market picture, investors have to look deeper.
Which is why I’m glad you’re following these updates.
Because just looking at price, you’d think Bitcoin’s correction this week was bearish.
It’s not.
It’s an opportunity. One of the best you’ll get in 2026.
And it’s what my Crypto Timing Model was calling for all along.
Why This Week Gave Me Déjà Vu
As we wrapped up last week, crypto looked ready for a breakout.
BTC was closing in on $100,000, and altcoins were doing even better.
What prompted the early rally? Anticipation that the CLARITY Act — which aims to establish clear rules for the U.S. crypto industry — was headed for markup in Congress.
Naturally, crypto market participants everywhere were keen to finally get their hands on an actual early draft of this bill.
But as I said last week, this would be a weak catalyst. One unlikely to produce a sustainable rally beyond a short-term reaction.
That’s because my Crypto Timing Model — along with liquidity indicators — warned of a significant low between Jan. 17-20. And another on Feb. 15-20.
That’s big.
While a range like this on my model makes pinpointing the exact low tough, it also gives insight into how this low will come about.
In short, I expected as early as Q4 last year that we would see BTC decline as we entered that first window, between Jan. 17-20. And that decline could last until mid-February.
And the first part of that played out exactly.
The Clarity Act negotiations stalled … and Bitcoin suddenly seemed to slip into leaden overshoes.
Then, the Trump administration threatened additional tariffs if the EU continued to oppose America’s acquisition of Greenland.
European officials reacted with a flurry of tariff threats of their own.
Politically, this new round of trade-war rhetoric may have seemed like just another entertaining kerfuffle out of the White House.
But the timing of it is quite revealing. Because it comes just as crypto markets approach another 320-day-cycle bottom.
Last June, I let you in on a hidden correlation found in my model: For each significant high and low it identifies, there has been a corresponding macro event play out.
Sure enough, this latest drama around the CLARITY Act and tariffs feels a lot like what happened as the crypto market approached a key 320-day low last April.
That bottom hit just as President Trump famously announced his “Liberation Day” tariffs — triggering widespread panic across financial markets.
Then, on April 7, Trump announced a 90-day pause on the policy. That marked the end of the first round of the trade wars and sent markets surging immediately afterward.
That wasn’t an isolated event. I’ve actually lost track of how many rounds there have been since.
But the script certainly rhymes. And my model picked up on all of them.
Now, markets are once again getting spooked as trade tensions resurface.
Today’s Crypto Outlook Resembles Early 2025
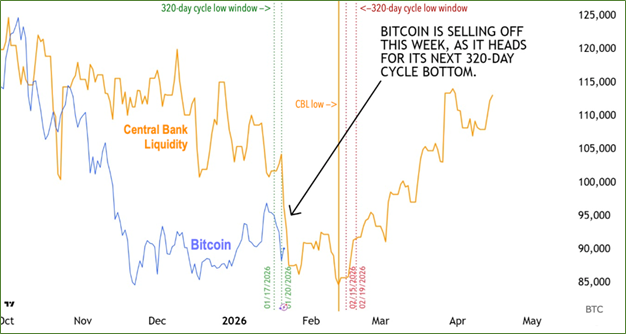
The dotted green vertical lines mark where we are now, the January reversal window. Bitcoin could establish the low projected by Central Bank Liquidity (CBL) — highlighted by the solid orange vertical line — within this window.
The second potential window falls between Feb. 15 and 20, marked by the dotted red vertical lines. Bitcoin could just as easily make its final low there.
At this point, both scenarios are plausible.
All that’s needed is an official announcement from the White House that the latest round of negotiations has concluded successfully — and markets could surge.
Most encouraging of all, note how CBL continues to make new highs.
Things looked dicey for a short time last week. But as my Crypto Timing Model suggests, it now appears the rally that’s set to begin after the low is made could extend into mid-April.
How high do I think it’ll go?
That’s tougher to say. But based on the cycles and liquidity, I expect it’ll hit near the $110,000 area.
The only remaining question is what the interim will look like as we wait for the low to be confirmed.
Bitcoin could stick around the high $80,000 range. After all, it has found consistent support there since the 80-day-cycle low on Nov. 21.
However, we cannot rule out another dip meaningfully below $90,000 between now and mid-February.
This divergence means you should take a hard look at your strategy.
Long-term investors may feel the near-term downside risk a reasonable risk if it means locking in current prices.
Traders with narrower margins may want to wait before jumping in.
Or you could always hedge your bets and enter in small, measured steps between now and the February window.
To see what approach I recommend my Weiss Crypto Investors take, click here.
No matter which strategy works best for you, I suggest you plan out your entrance now.
Because the near-term outlook for crypto is becoming more bullish by the day.
And if you miss this window, you may find yourself chasing the crypto market — rather than profiting from it — through April.
Best,
Juan Villaverde
