This Model Saw Friday’s Sell-off Coming a Mile Away
 |
| By Bob Czeschin |
The Sino-American trade war erupted with a vengeance late last week, raining fire and brimstone down on world investment markets.
Out of the blue, Beijing decreed new controls on Chinese rare earth exports. Plus, steep docking charges on ships bringing U.S. goods to Chinese ports.
President Trump immediately fired back on social media. He imposed new 100% tariffs on Chinese imports on top of already existing tariffs.
Investment markets convulsed on the news.
Gold shot to new highs above $4,000 an ounce.
But stocks and cryptos took it on the chin.
The S&P500 plummeted 2.9%. The NASDAQ careened 4.1% lower.
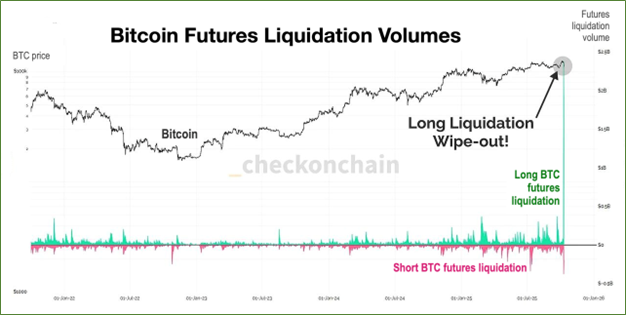
And crypto? It suffered one of the biggest liquidation events in financial history.
A whopping $19.31 billion got wiped out.
That’s a dozen times the losses suffered in the FTX debacle in 2022. And 16x those inflicted during the COVID crash ($1.2 billion).
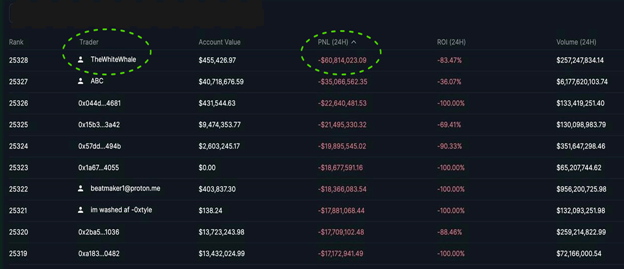
Seen from a trader’s point of view, the damage was no less extensive.
- More than 1,000 wallets on perpetual futures exchange Hyperliquid got wiped out. They lost everything.
- Some 6,300 wallets wound up in the red, with combined losses exceeding $1.23 billion.
- 205 wallets lost over $1 million. And …
- 1,070 wallets lost over $100,000.
The worst performing wallet — dubbed TheWhiteWhale — lost a thumping $60.8 million.
The Hunt for Red Uptober
Friday’s bloody carnage obviously took these hapless wallet holders by surprise — along with millions of other crypto market participants.
Related Story: Friday Saw DeFi’s Finest Hour
All the more so because October has historically been buoyant month for crypto asset prices.
However, Weiss Crypto Portfoliomembers were already on the hunt for an October surprise full of red ink.
That’s because editor Juan Villaverde’s Crypto Timing Model warned them months ago: A major critical, major low for crypto markets was coming in mid-October.
Indeed, the issue Juan published just 24 hours before the meltdown said: “Bitcoin Gets Cold Feet After Hitting All-time Highs.”
And it included the following chart illustrating the indicators pointing toward lower prices.
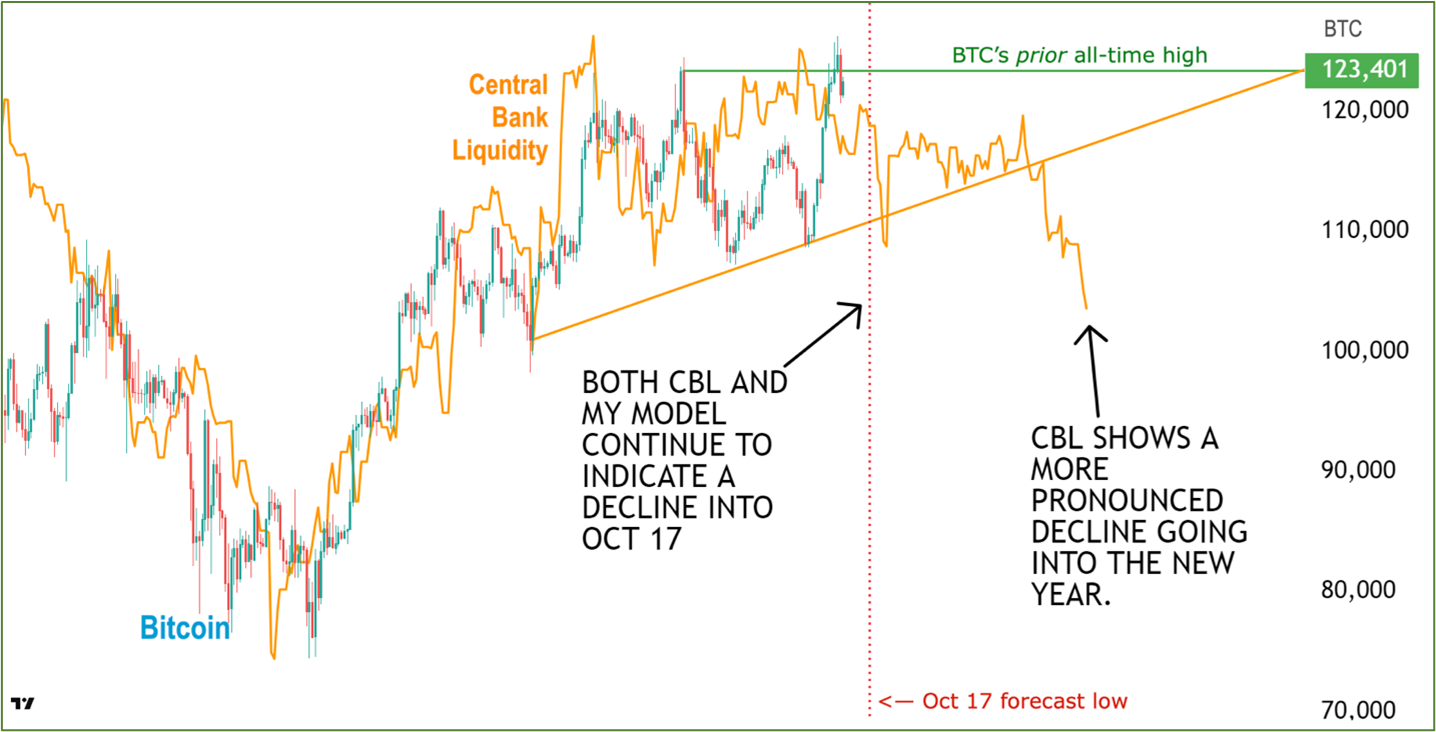
Central Bank liquidity (CBL) tends to mirror Bitcoin’s (BTC, “A-”) price path 88 days in advance. This makes it a very useful leading indicator.
But notice, CBL started turning down even before Bitcoin poked up to new highs above the green horizontal line.
This was clear evidence of short-term bearish forces gathering strength below the surface of visible price action.
Plus, it lined up quite nicely with Juan’s model, which called for a major low on or near Oct. 17.
As it happened, this major low appears to have come about a week early. This sometimes happens when some external shock — like the Sino-American trade spat — occurs. And knocks the market’s internal cycles a bit off the pace that would otherwise prevail had they remained undisturbed.
Chronicle of Events Foretold
One very healthy aspect of Friday’s bloodletting is that it purged major crypto exchanges around the world of excess leverage.
That forced weak hands out of the market. And with the selling mostly exhausted, this typically helps clear the deck for a fresh uptrend.
And indeed, buyers are stepping back in. Markets are rebounding as I write. However, CBL declines rather sharply again in December. (Observe the right-hand arrow in Figure 3, above).
So, if crypto is to continue to rally much past post-October, it’s going to have to swim against the tide of falling CBL.
That’s not unheard of. But it will likely be an uphill battle, nonetheless.
The good news is that this is still some weeks away. And between now and then, CBL actually anticipates Bitcoin going up.
If the world’s largest crypto is making new all-time highs during this interval, it’s probably safe to say this bull market has farther to go.
And to see what Juan’s Crypto Timing Model says in more detail, watch his latest crypto briefing here.
Best,
Bob Czeschin