VanEck’s Latest Data: Bitcoin Has Started to Shift Gears

 |
| By Mark Gough |
Bitcoin (BTC, “B+”) has gone nowhere this summer.
Now, VanEck’s latest data1 suggests that could change as we move into the fall.
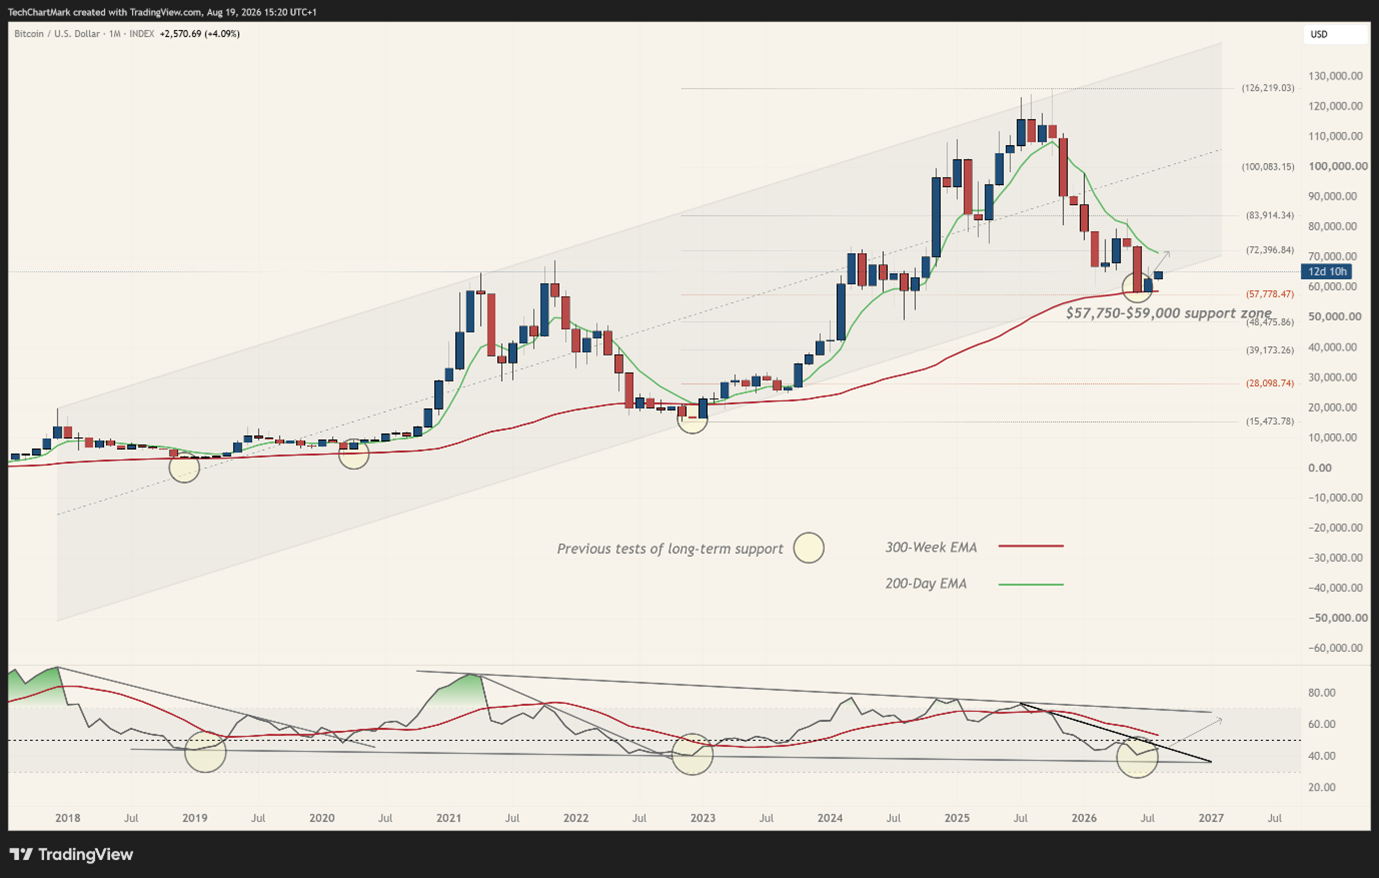
After first testing the $60,000 area in February, it returned to that support zone in July. It briefly undercut the February low and fell to approximately $57,750 on July 1.
Buyers stepped in and pushed Bitcoin back into the mid-$60,000s and recovery from there has since stalled below resistance.
Now, the monthly chart is beginning to improve.
Bitcoin has held above the July low and is attempting to turn higher, even as volatility and trading volumes remain unusually subdued.
Still, anyone waiting for a clear answer on whether the correction is over must be frustrated. I know that I am.
But beneath the price action, evidence that a longer-term bottom is forming continues to build.
The latest nail comes from VanEck’s Bitcoin ChainCheck. Released yesterday, it adds reports that eight of its 12 capitulation signals are now flashing. And all 12 entered capitulation territory at some point during the past three months.
None of this proves the bottom is in. It does, however, support what we have been saying for months: Bitcoin is working through a broad bottoming and accumulation.
It could take time to complete, but the process is underway.
How We Got Here: $58,000 Is Our North Star
Back in January, I warned my Next Crypto Superstars members that Bitcoin could fall into the $58,000 to $60,000 area.
That zone mattered for two reasons.
- The 300-week exponential moving average (EMA) was sitting near $58,300.
- The 61.8% Fibonacci retracement of the previous advance came in at $57,750.
Since 2015 — and aside from brief wicks below it in 2018 and 2020, both of which marked the market low — Bitcoin has only traded below the 300-week EMA during the FTX-driven sell-off.
When two important long-term levels sit within a few hundred dollars of each other, I pay attention.
Bitcoin hit $57,750 on July 1, and buyers stepped in. It has not returned to that low since.
That first reaction was encouraging. But one bounce is never enough to confirm a bottom.
Which is why I continued to see Bitcoin as range-bound: Support sits near $58,000 to $59,000, the first important resistance around $69,000 to $72,000, and the main range ceiling at $82,000 to $83,000.
So far, that view has held up.
Now, VanEck’s on-chain data gives us another piece of the puzzle.
What 8 Capitulation Signals Tell Us
Capitulation happens when selling pressure, investor losses and market pessimism reach unusually high levels. It is the stage when weaker holders have already sold, leverage has been cleared out, and the remaining sellers begin to run out of ammunition.
In short, it’s the quiet environment in which a market finds its bottom.
VanEck tracks 12 market and on-chain measures for capitulation. That includes the share of Bitcoin supply held at a profit, unrealized investor losses and miner revenue.
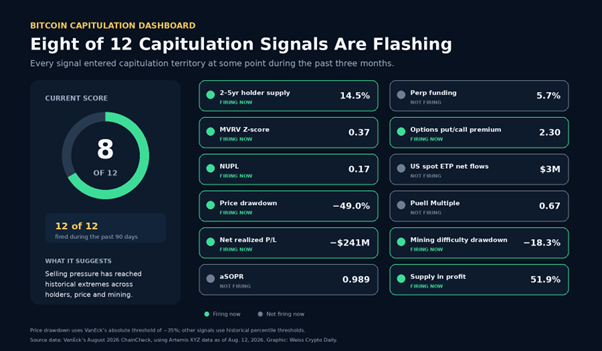
Eight are currently at historical extremes. All 12 reached those extremes at some point during the past 90 days.
VanEck’s conclusion: Bitcoin appears to have experienced capitulation and may now be entering an accumulation phase.
That fits the price action.
Bitcoin has absorbed months of bad news without making a new low. It has held despite high long-term interest rates, continued geopolitical uncertainty and selling from Strategy (MSTR).
Sometimes a market shows strength by rising. At other times, it shows strength simply by refusing to fall when it has every excuse to do so.
Bitcoin is currently doing the latter.
A Bottoming Process Is NOT the Same as a Bull Market
This is where investors need to be careful …
Eight capitulation signals do not mean Bitcoin will rally immediately.
VanEck tested what happened after similar readings in the past. It’s conclusion? The immediate aftermath showed mixed results.
When eight to 12 indicators were flashing, Bitcoin’s average return over the following 90 days was 12.8%. Over 180 days, it was 32%. Both figures were actually below Bitcoin’s normal historical return over the same periods.
The stronger results appeared over one year. And even that came from a small number of heavily overlapping market episodes.
That is a long way of saying that this data may help us identify a good accumulation area. What it can’t do is act as a reliable short-term timing signal.
(For a reliable market timing model, I suggest you check out my colleague Juan Villaverde’s Crypto Timing Model and how he uses it in his Weiss Crypto Investor newsletter.)
This is also consistent with Bitcoin’s earlier cycles.
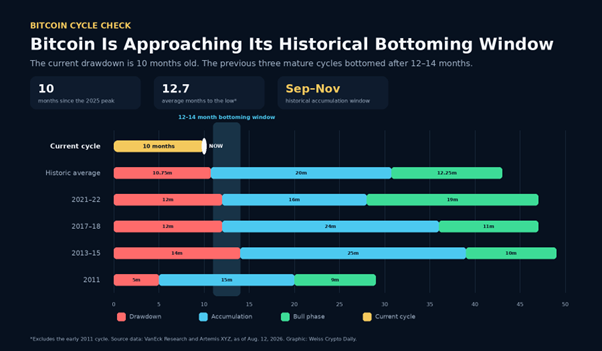
Excluding the very young market of 2011, the previous three peak-to-trough declines lasted an average of 12.7 months. The current correction began after Bitcoin peaked in October 2025, placing the historical window for an accumulation phase around September to November 2026.
History does not have to repeat on schedule. Still, the timing, price structure, and on-chain data are pointing in the same direction.
And as we know from Juan about the crypto cycles, events do tend to rhyme.
Why This Decline May Be Shallower Than Earlier Bear Markets
Previous Bitcoin bear markets produced losses of 78% to 94%. This correction has pulled us only about 55% from the October 2025 high.
By old Bitcoin standards, that may not look severe enough to mark a major low.
But this is not the same market we had in 2018 or 2022.
The earlier crashes included the collapse of major exchanges, lenders and leveraged funds — Mt. Gox, BitConnect, Terra, Celsius, Three Arrows Capital and FTX all created forced selling that spread across the industry.
We have not seen an equivalent failure during this correction. And Bitcoin also strengthened its resilience thanks to a much larger institutional investor base and a spot ETF market that can absorb supply.
U.S.-based spot Bitcoin products took in approximately $663 million over the 30 days covered by VanEck’s report. That reversed the heavy outflows seen during the previous month.
If the market has fewer forced sellers and a larger pool of long-term buyers, a shallower decline than in previous cycles is reasonable to expect.
That does not remove downside risk. It simply means waiting for another 80% collapse — as we’ve done in the past — could leave investors waiting for a price that never arrives.
Long-Term Holders Are Moving Coins
There is one part of the report I would not ignore. And that’s who’s moving their holdings around.
The amount of Bitcoin held for more than one year fell by roughly 356,000 BTC during the latest 30-day period. Long-term holdings dropped to 11.84 million BTC, or 59.1% of circulating supply.
Most of that reduction came from coins held for one to five years. The oldest holders barely moved.
Some of this activity may reflect investors moving coins between wallets rather than selling them. Indeed, the recent Coldcard security failure may also have encouraged some long-term holders to move funds as a precaution.
Even so, 356,000 BTC is too large to dismiss as routine wallet maintenance. The movement is consistent with some holders reducing exposure or taking profits.
On the other hand, it still doesn't tell us how much of that Bitcoin reached exchanges.
What we do know is that Bitcoin has held above its July low despite this sharp increase in long-term-holder activity. And if exchange-bound selling slows while ETF demand continues, the balance could shift increasingly in favor of buyers.
Miner Stress Supports the Capitulation Case
Bitcoin miners are under growing financial pressure.
Remember, miners on the Bitcoin blockchain are responsible for validating transactions. Their rewarded in BTC.
But …
- The latest halving reduced the block subsidy to 3.15 BTC,
- ETF activity has not created enough on-chain fees to replace that lost revenue,
- And network competition remains intense.
This is why so many listed miners are shifting power capacity towards artificial intelligence and high-performance computing.
VanEck’s latest figures show daily miner revenue down 46% from a year ago. Mining difficulty was 18.3% below its November 2025 peak, the largest decline since China banned Bitcoin mining in 2021.
This suggests weaker operations have already been forced offline.
Pressure like this doesn’t just hurts miners. It’s also common around major Bitcoin lows.
Inefficient operators leave, stronger miners survive, and one source of forced selling eventually fades.
The Levels That Matter Now
Bitcoin was trading near $64,800 as I began to write this. However, in just the past 5 hours, BTC has shot up to near $68,300.
That said, we’ll need to see whether this move is a temporary response to a catalyst, or a confident move higher. So, my technical outlook remains for now.
Here are the larger levels I am watching remain:
- $58,000 to $59,000: The main long-term support zone. A decisive weekly break below it would reopen the risk of a move towards $48,000.
- $69,000 to $72,000: The first important trend-recovery area and the approximate location of both the 200-day moving average and the yearly volume-weighted average price (VWAP). A sustained move above this range — which BTC is knocking at now — would improve the medium-term picture.
- $82,000 to $83,000: The level Bitcoin needs to reclaim before I would treat this as more than a recovery inside a large range. In short, if BTC breaks above here, I would say we’ve broken out of the range that has lasted all summer.
I also want to see the monthly relative strength index recover above 50. That would show momentum has moved back into a healthier long-term regime.
Until then, the chart is improving. But the new bull phase is not confirmed.
Where This Leaves Bitcoin
VanEck’s report suggests much of the damage may already be done.
Eight capitulation signals are flashing.
Bitcoin has held the support area we identified months ago.
Miner stress is forcing weaker operators out.
ETF flows have turned positive again, and Bitcoin has held firm despite a sharp increase in coin movement from long-term holders.
These are the conditions we would expect to see during accumulation.
As I said, however, this isn’t your sign to go on a shopping spree. But I also don’t suggest you wait for the actual bull market to begin before planning your approach.
My recommendation would be to build exposure gradually here than wait for a perfect sign that the absolute bottom is in.
Best,
Mark