Bitcoin’s Rebound Proves Strategy’s Sale Insignificant
 |
| By Mark Gough |
I hope you’ve been following Juan Villaverde’s crypto cycles updates.
Built off his Crypto Timing Model and key liquidity indicators, Juan’s analysis cuts out the headline-driven noise to help you see what’s really making Bitcoin (BTC, “B+”) move.
That’s critical when it comes to crypto. Even experienced traders can still get tripped up by headline-driven fear and FOMO if they’re not careful.
In fact, we saw that happen earlier this month.
The Story You Heard
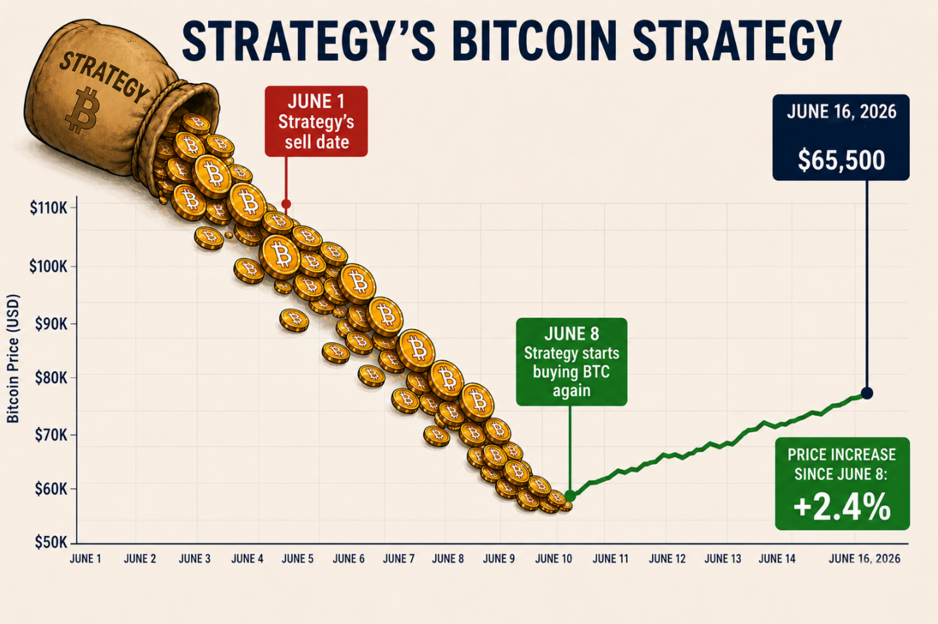
It didn’t take long for headlines to declare a villain when Bitcoin fell from $71,000 to $59,000 over the first week of June.
That’s because whenever Bitcoin suffers a sharp correction, the market immediately starts searching for a reason.
Before the dust had settled, commentators across social media and financial media were pointing to Strategy’s (MSTR) sale of 32 Bitcoin — which net $2.5 million — as the catalyst for the correction.
Over the past decade, I’ve watched governments, exchanges, hedge funds, miners, whales, and countless other market participants take turns carrying the blame.
I’ve been critical of aspects of Strategy’s Bitcoin accumulation strategy in the past.
But that doesn’t change the fact that the market was already moving lower before the headlines appeared.
When you examine the timeline of events, the technical structure and the broader market backdrop, the evidence points elsewhere.
The Real Cause of the Sell-Off
The reality is that Bitcoin’s decline had very little to do with Strategy’s sale.
Rather, the sell-off had almost everything to do with what was happening across the broader financial markets.
Back in early May, I highlighted the 7,600 level on the S&P 500 as a major area of interest.
When the index finally broke down from that region on June 2, it triggered a decline of 5%, eventually testing the 7,200 area and putting pressure on risk assets across the board.
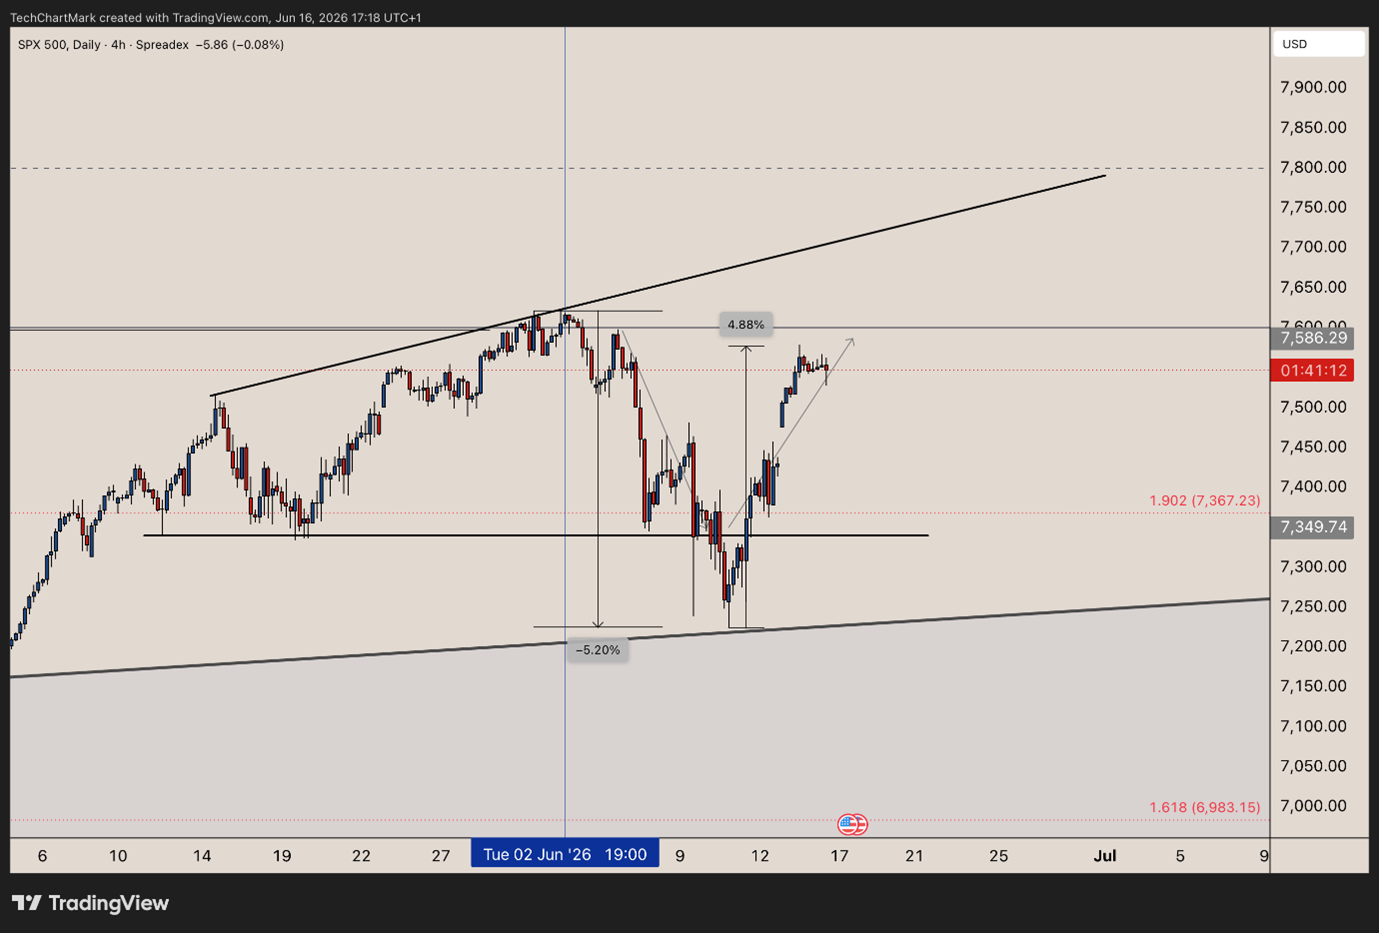
Bitcoin was no exception.
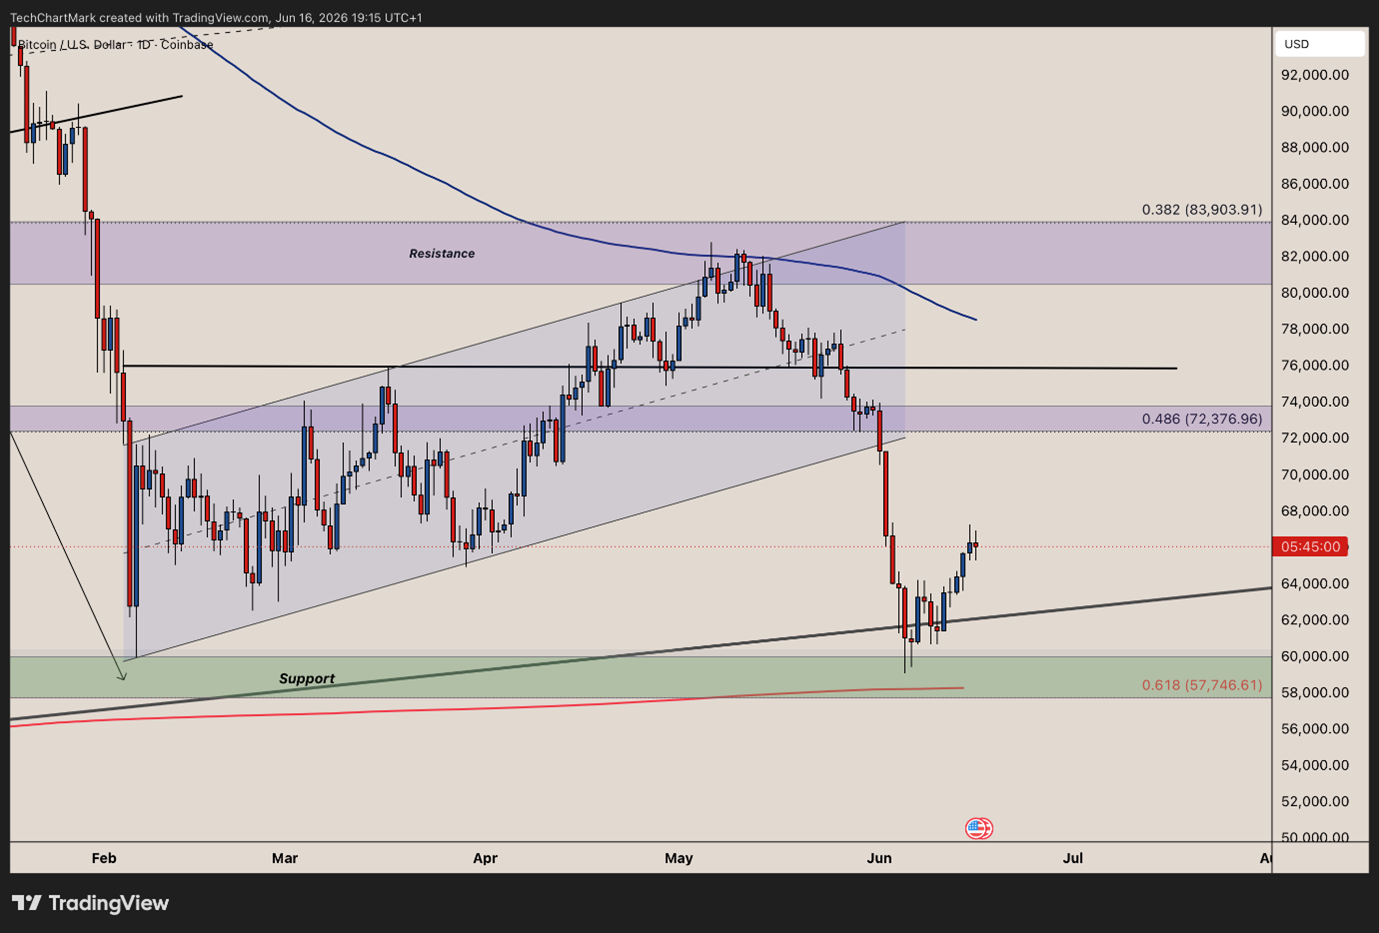
At the time of the equity market breakdown, Bitcoin was trading near $71,000. As stocks weakened, Bitcoin followed, eventually falling to $59,000 and retesting its February lows.
Regular readers and viewers will know this move didn’t come as a surprise. Throughout May, I highlighted the $82,000 area as a likely point of resistance and warned that Bitcoin could struggle to break through on its first attempt.
The roadmap was relatively straightforward:
A rejection from $82,000 would likely send price back toward the edge of the parallel channel around $71,000.
If that level failed to hold, then the February lows would come back into play.
Not only that, my outlook also fell perfectly in line with what Juan’s model and indicators signalled: That Bitcoin would fall following its early May high to test $60,000 by late June.
That’s exactly what happened.
The market followed the technical structure I identified and validated Juan’s predictive model.
Well before Strategy’s sale entered the conversation.
This makes it difficult to argue that a relatively small transaction was responsible for a decline that both the charts and the broader macro backdrop had already identified.
The ‘Saylor Effect’ Doesn’t Add Up
Let’s put the sale into perspective.
Bitcoin trades hundreds of billions of dollars in daily volume across exchanges, ETFs, institutions and over-the-counter markets worldwide.
If a sale of such a small amount of Bitcoin could genuinely erase more than $10,000 from the price, it would suggest a market far less liquid and mature than we thought.
Fortunately, the data suggests otherwise.
Even on its busiest days, Strategy represents only a tiny fraction — 1%-2% — of overall Bitcoin trading activity.
The company remains one of the largest corporate holders of Bitcoin. But its day-to-day transactions1 are not large enough to dictate the direction of a trillion-dollar asset class.
The idea that a single relatively small sale triggered a market-wide decline ignores the scale of the underlying Bitcoin market and the enormous amount of capital now participating in it.
The bid supporting Bitcoin today is far larger than any single buyer or seller.
It’s also worth looking at what Strategy has done since.
Rather than reduce its exposure, the company has continued to accumulate. Not surprising when you consider Strategy’s initial reason for selling.
Unlike what the headlines may have led you to believe, the sale wasn’t a commentary on Strategy’s Bitcoin outlook. It was instead a strategic move to cover near-term liquidity needs to pay out preferred dividend payments.
Since that sale, Strategy has announced two separate Bitcoin purchases. The first added 1,550 BTC to its holdings, while the second added another 1,588 BTC.
Alongside those purchases, the company increased its reserve program by $100 million on each occasion, bringing the total reserve to approximately $1.1 billion.
In other words, the same company that some commentators blamed for Bitcoin’s correction with the sale of 32 BTC …
Has since acquired more than 3,000 additional BTC.
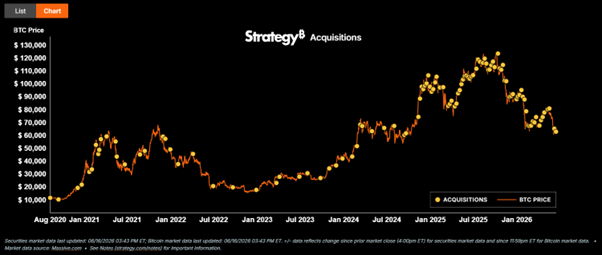
That doesn’t look like a company heading for the exits.
It looks like a company continuing to execute its long-term accumulation strategy.
That said, there is a more legitimate concern worth discussing.
As I’ve noted before, I’m not a fan of the financing structure behind many corporate Bitcoin treasury strategies.
While Strategy’s sale didn’t cause this correction, the company’s growing influence raises a more important question …
Could Strategy Become a Risk in the Future?
At present, there are no obvious signs of financial stress.
Strategy continues to raise capital and add to its Bitcoin position. This suggests management remains focused on accumulation rather than liquidation.
However, leverage always introduces risk.
If Bitcoin were to enter a prolonged bear market — or capital markets became less willing to provide financing — we would likely discover which Bitcoin treasury strategies are built to withstand a downturn and which are dependent on continued access to capital.
It’s also worth remembering that Strategy is no longer alone.
A growing number of public companies now use similar financing structures to acquire digital assets.
That makes balance sheet strength and access to capital increasingly important factors to monitor.
Final Thoughts
Markets love simple explanations.
But the reality is usually more complicated. In this case, Bitcoin’s correction was already underway before Strategy sold.
The broader evidence points to macro conditions and technical market structure as the primary drivers of the decline.
Headlines come and go. Price action tells the real story.
Which makes the key takeaway from all this clear: The Strategy headlines are mostly noise.
The current price action looks a lot more like a normal cyclical correction driven by macro conditions and market structure.
And according to Juan’s Crypto Timing Model, the end of this correction — and the best time to load up on your favorite cryptos — is just around the corner.
To see which crypto his model will target for long-term investment possibilities, click here.
Best,
Mark Gough